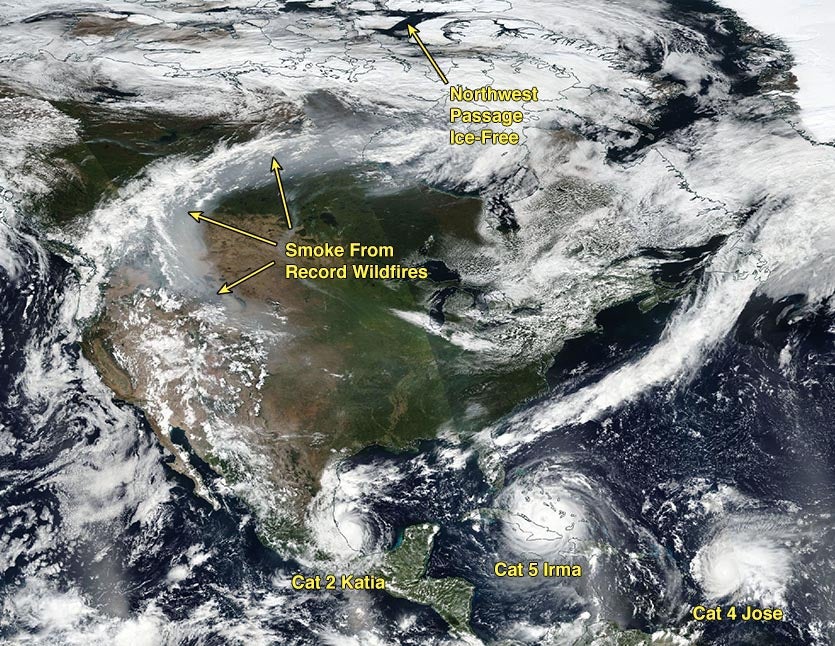
| Above: The future was now in 2017. In a scene that climate scientists say we should see more of in a future warmer climate, the GOES-16 satellite image from September 8, 2017 showed multiple intense hurricanes in the Atlantic, along with smoke from large wildfires and an ice-free Northwest Passage. |
In 2017, the atmosphere seemed to have it in for the United States. Globally, the lion’s share of destruction from each of the world’s four costliest weather-related disasters occurred within U.S. states and territories, and each one involved either hurricanes or wildfires. Through September, NOAA tallied 15 U.S weather disasters in 2017 with a cost of at least $1 billion, and the December wildfires in Southern California may well add another billion-dollar disaster to the total. This would tie 2017 with 2011 for the most billion-dollar weather disasters in any year in U.S. history.
Granted, the U.S. is a meteorological crossroads that’s renowned for getting virtually every type of meteorological mayhem, but it’s unusual for the nation to have such a lopsided share of the global toll from a year’s worth of weather/climate disasters. One preliminary damage assessment put the U.S. damage from Maria, Harvey, and Irma at $207 billion, with another $25 billion in non-U.S. damage. Thus, our picks below for the planet’s highest-impact weather and climate events of 2017 are very U.S.-centric.
Three events tied for #1 in 2017: Hurricanes Harvey, Irma, and Maria
The most hellacious series of Atlantic hurricanes since 2005 produced catastrophic damage in a number of Caribbean nations as well as Puerto Rico, the U.S. Virgin Islands, and the U.S. mainland. One reason: at the peak of hurricane season, sea-surface temperatures were at near-record warm levels across most of the tropical Atlantic. Moreover, upper-level winds (with an assist from La Niña) were unusually supportive for allowing hurricanes to thrive (bringing low wind shear), and steering currents favored trajectories toward land, with a grand total of 23 landfalls for the year. The period from late August to early October saw a nearly unbroken string of Atlantic hurricanes in progress, and September produced the largest amount of accumulated cyclone energy (ACE) of any month on record.
 |
| Figure 1. First-light GOES-16 image of Hurricane Maria taken at 7:15 am EDT September 20, 2017, just after the hurricane had made landfall in Puerto Rico as a top-end Category 4 storm with 155 mph winds. Maria's eye was obscured by clouds due to interactions with land. Image credit: NOAA/RAMMB. |
1. Hurricane Maria
Hurricane Maria hit the island of Dominica in the Caribbean as a Category 5 hurricane with 160 mph winds, then powered through the Virgin Islands and Puerto Rico as a top-end Category 4 storm with 155 mph winds, causing catastrophic damage and at least 47 deaths outside of Puerto Rico. The death toll from Maria in Puerto Rico is likely to top 1,000 when indirect deaths that occurred in the weeks and months after Maria’s passage are fully taken into account. This would make Maria only the second hurricane since 1928, along with Katrina of 2005, to have caused at least 1,000 deaths in the U.S. or its territories. Total damage across the Caribbean from Maria has not yet been fully tallied, but some estimates are in excess of $100 billion (insured plus uninsured damage), which would make Maria more costly than any hurricane except Hurricane Katrina ($161 billion in damage in 2005). Overall, it appears that Maria will be the deadliest Atlantic hurricane since 2005’s Stan, which took more than 1,500 lives in Guatemala and another 150+ in neighboring countries.
Maria also became a political flash point, as it highlighted Puerto Rico’s fragile infrastructure and the lack of urgency one might see in recovery efforts for a similar disaster in a U.S. state versus a territory. More than a million residents still lacked power as of late December. According to New York Times reporter Frances Robles, the U.S. Corps of Engineers estimates that power will not be fully restored to rural parts of Puerto Rico until the end of May—a full eight months after Maria.
 |
| Figure 2. Storm-total rainfall from Hurricane Harvey, August 24 – 31, 2017. Harvey dumped over 40” (yellow colors) in Houston, with isolated amounts in excess of 50” (pink colors) south of Houston and northwest of Port Arthur. Image credit: NOAA. |
Tied for #1: Hurricane Harvey
Hurricane Harvey was spectacular in terms of rainfall, as a result of its slow movement near the southeast Texas coast following landfall at Category 4 strength just north of Corpus Christi. At least 40” of rain fell across a gigantic area from Houston to Port Arthur—larger than the entire state of Delaware. The storm total of 60.58” at Nederland, TX, was the heaviest single amount ever recorded from a tropical cyclone or its remnants in the U.S. One analysis found that Houston could expect Harvey-like rains only about once every 2000 years—but that climate change is already making such rains far more likely.
Harvey caused at least 84 direct and indirect deaths, primarily from massive flooding across southeast Texas, including many places outside the 100-year flood plain. The total cost of Harvey (including insured and noninsured losses) was estimated by insurance broker Aon Benfield at $90 billion. Among U.S. hurricanes, this comes in behind only the $161 billion in total damage from 2005’s Hurricane Katrina, as estimated by NOAA’s National Centers for Environmental Information. Hurricane Maria may exceed Harvey's damage once the final numbers are in, though.
 |
| Figure 3. Recently planted palm trees lie across a road in Miami Beach, FL, on Sunday, September 10, 2017, due to Hurricane Irma's landfall. Image credit: Wilfredo Lee/AP. |
Also tied for #1: Hurricane Irma
Irma was neither the deadliest nor most destructive Atlantic hurricane of 2017—but in most other years, it would have been an epic disaster all its own. Irma churned across or near several Caribbean islands as a Category 5 storm packing 185 mph winds, the strongest winds of any tropical cyclone on Earth this year. Irma made destructive landfalls in Antigua and Barbuda, Saint Martin, Anguilla, Turks and Caicos, The Bahamas, and Cuba, as well as the United States. Before it moved up the west coast of Florida, Irma angled just far enough leftward to rake the north coast of Cuba, a shift that resulted in 10 deaths and $2.1 billion in damage there. Had Irma not been disrupted by its encounter with Cuba, it might have produced far greater destruction in Florida. All told, Irma took 124 lives and wreaked an estimated $50 billion in total damage along its path, according to Aon Benfield.
 |
| Figure 4. Christmas decorations illuminate a house in Carpinteria, Calif., as the growing Thomas Fire advances toward Santa Barbara County seaside communities on December 10, 2017. Image credit: David McNew/Getty Images. |
4. California wildfires (October-December)
After an unusually slow start to the U.S. fire season caused by a wet winter, the fire season of 2017 put on an intense blitz of the Western U.S., burning 9.6 million acres--the third highest total since accurate records began in 1960, according to the National Interagency Fire Center. The last three months of the year brought two devastating clusters of wildfire to California. The stage for disaster was set by a near-record wet winter in 2016–17, which led to a bumper crop of fire-vulnerable shrubs and grasses. California’s hottest summer on record eventually left the fresh vegetation tinder-dry, and cool-season rains were unusually slow to return to the state.
The first of the year’s two firestorms burst into being on the night of October 8-9, when a fierce round of hot, dry winds gusting to more than 60 mph swept through the North Bay Hills of California. The strong winds tossed embers well ahead of the fire line, leading to extremely rapid fire spread. Many residents had only a few scant minutes to evacuate. The Tubbs Fire pushed from the urban/wildland interface well into the city of Santa Rosa, scorching more than 36,000 acres and consuming 5,643 structures in all—almost twice the structural toll of any other fire in Cal Fire records. At least 44 people died as a direct result of the October fires, the largest U.S. death toll from a wildfire event in nearly 100 years.
In December, persistent offshore Santa Ana winds led to the worst late-season fires in California history across the coastal hills from Santa Barbara to San Diego. The biggest and most destructive was the Thomas Fire in Ventura and Santa Barbara Counties. The Thomas Fire became the largest in reliable state history on December 22 when its coverage reached 273,400 acres, topping 2003’s Cedar Fire (273,246 acres). The Thomas Fire consumed at least 1,063 structures, with hundreds of other buildings destroyed in five other major wildfires across the region. The Santa Ana winds arrived during a normal climatological peak, but their effects were intensified by the extensive dried-out vegetation and by the near-record warm, dry conditions that prevailed across Southern California throughout the autumn and into December.
 |
| Figure 5. Motorcyclists ride through thick smog on January 9, 2017, in Zhengzhou, China. The nation’s Central Meteorological Observatory issued a yellow alert for smog in Zhengzhou on January 8 - 9, and visibility dropped below 50 meters (160 feet) in parts of the city on January 9. Image credit: VCG/VCG via Getty Images. |
5. Outdoor air pollution killed over 2 million people globally in 2017
The deadliest and costliest weather events of 2017 were very likely high-pressure systems with light winds and stagnant air that led to lethal build-ups of dangerous air pollutants in Asia. One such event, a severe air pollution episode exacerbated by fireworks displays during India’s Diwali celebrations, hit the most polluted major city in the world—New Delhi, India—on October 19 - 20, 2017. Delhi’s 24-hour levels of the deadliest air pollutant—fine particulate matter (PM 2.5)—hit 449 micrograms per cubic meter, which is 18 times higher than the World Health Organization guideline of 25 micrograms per cubic meter. Sustained breathing of air pollution at these levels is like smoking about a pack of cigarettes per day.
China and India suffer approximately 1.1 million premature air pollution deaths each year, according to research published in February 2017. Many of these deaths are from indoor air pollution from smoky cook stoves; only 42% of global air pollution deaths are from outdoor air pollution, according to the World Health Organization. The World Bank estimated in 2016 that premature deaths due to both indoor and outdoor air pollution in 2013 (the most recent year statistics were available) were 5.5 million people, at a cost of over $5 trillion. The total costs to countries in East and South Asia related to air pollution mortality were about 7.5 percent of GDP, they estimated. Additional health care costs to people who did not die were not considered, and neither was pollution damage done to agriculture. Computer modeling by Stanford professor Mark Jacobson in 2016 predicted that the total cost of air pollution globally under a business-as-usual emissions path would reach $23 trillion per year (7.6% of global GDP) by 2050. Thus, any progress in combatting climate change by burning fewer fossil fuels will result in immense savings in lives and dollars due to reduced air pollution.
 |
| Figure 6. Mud and water flow through Freetown, Sierra Leone, on Monday, Aug. 14, 2017, following torrential rains in the area. Image credit: Society 4 Climate Change Communication via AP. |
6. Sierra Leone flash flood and mudslide (August)
A round of torrential overnight thunderstorms on August 13-14 led to the worst natural disaster on record in Sierra Leone and the planet’s deadliest weather disaster of 2017 apart from Hurricane Maria. At least 1,050 people were killed as floodwaters and mudslides poured through the region surrounding Freetown, the capitol of the West African nation.
In the weeks leading up to the disaster, Sierra Leone saw much-above-average rainfall, a result of the same vigorous train of Cape Verde easterly waves that seeded the Atlantic’s disastrous hurricane season. Development patterns in and around Freetown exacerbated the impact, with many homes built within flood plains, hillsides deforested, and drainage systems compromised.
 |
| Figure 7. A boy looks at dead goats in a dry land close to Dhahar in Puntland, northeastern Somalia, on December 15, 2016. Drought in the region severely affected livestock for local herdsmen. Image credit: ABDIWAHAB/AFP/Getty Images |
7. East Africa drought (Jan-Mar)
Scant rainfall in both the “long” and “short” rainy seasons of 2016 left the Horn of Africa mired in drought in the first several months in 2017. Crop losses and other impacts in Somalia, Ethiopia, and Kenya added up to $1.9 billion, according to Aon Benfield. Some 1.8 million people in the three countries were displaced by the drought conditions in 2017, according to ReliefWeb.
At least 140 people died early this year in Somalia as a result of food shortages, and a related cholera outbreak in Somalia took at least 1,159 additional lives. (In developing countries, drought often leaves water supplies more vulnerable to contamination.) Somalia was also the site of the world’s deadliest weather-related disaster of the past 34 years: the 2010 - 2011 drought and famine, which killed 258,000 people.
 |
| Figure 8. Aerial view of a flooded street in Changsha, Hunan province, on July 2, 2017. Days of torrential rain in Hunan province raised the water level of the Xiangjiang River to exceed its record flood level. Image credit: STR/AFP/Getty Images. |
8. Yangtze River flooding, China
The most expensive non-U.S. weather disaster of 2017 was flooding in China's Yangtze River basin caused by the seasonal Mei-yu rains that killed 141 people in late June and early July, with a $7.5 billion price tag. Additional flooding in nine southern Chinese provinces from July 13 - 17 caused by heavy thunderstorms killed 20 and damaged or destroyed more than 58,000 homes, causing $4.5 billion in damage.
The Yantgze Basin has experienced a number of catastrophic floods in years past, including disasters that took as many as 4,100 lives in 1998, 33,000 in 1954, and 4 million in 1931, including both direct and indirect deaths.
 |
| Figure 9. Firefighters battle a forest wildfire next to the village of Vilarinho in the Coimbra region of Portugal on Oct. 16, 2017. Image credit: Pablo Blazquez Dominguez/Getty Images. |
9. Iberian wildfires (June and October)
Much like California, Portugal was plagued by double wildfire disasters in 2017. Extreme heat and drought left the landscape highly vulnerable to fires throughout the spring, summer, and fall. A swarm of fires on June 17-18 left 64 people dead, the nation’s largest toll on record from wildfires up to that point. More than 100,000 acres were burned. The worst impacts were in the Pedrógão Grande area, where a rapidly growing fire swept across a roadway and killed 47 motorists.
Another set of fires across northern Portugal and northwestern Spain in mid-October got a jump-start from a rare meteorological setup: strong southeast winds flowing from the Sahara toward Tropical Storm Ophelia, which raced toward Ireland on October 14-15. More than 7,900 individual blazes took a total of at least 49 lives. Smoke and dust from the fires and the desert winds turned the sky orange across England and led to a “black rain” in Estonia. Portuguese prime minister Antonio Costa pledged to adopt recommendations that were produced as a result of the June fires, stating: "After this year, nothing should remain as it was before.”
 |
| Figure 10. NOAA analysis of global surface temperatures (including land and ocean areas) for the period January-November, 1880-2017. The warmest five years for this 11-month interval were 2016, 2015, 2017, and 2010 and 2014 (tied). Image credit: NOAA/NCEI. |
10. Near-record global temperature—despite no El Niño
As of late December, the global surface temperature for 2017 appeared virtually certain to end up as the second or third warmest in global data extending back to 1880. Assuming this is the case, then the world’s four warmest years on record will have all taken place since 2014. What’s especially eye-opening is that 2017 was a year of mainly weak La Niña conditions. Global temperatures are typically lower during La Niña and higher during and just after El Niño, which sends heat from the tropical oceans into the atmosphere. (You can find a dramatic animation of this phenomenon at skepticalscience.com.) It now appears 2017 will be the warmest year on record without any influence from an El Niño event.
For a deeper dive into U.S. weather stories of 2017, check out weather.com's national Top Ten list.
Bob Henson wrote most of this post. Happy New Year, everyone!


