
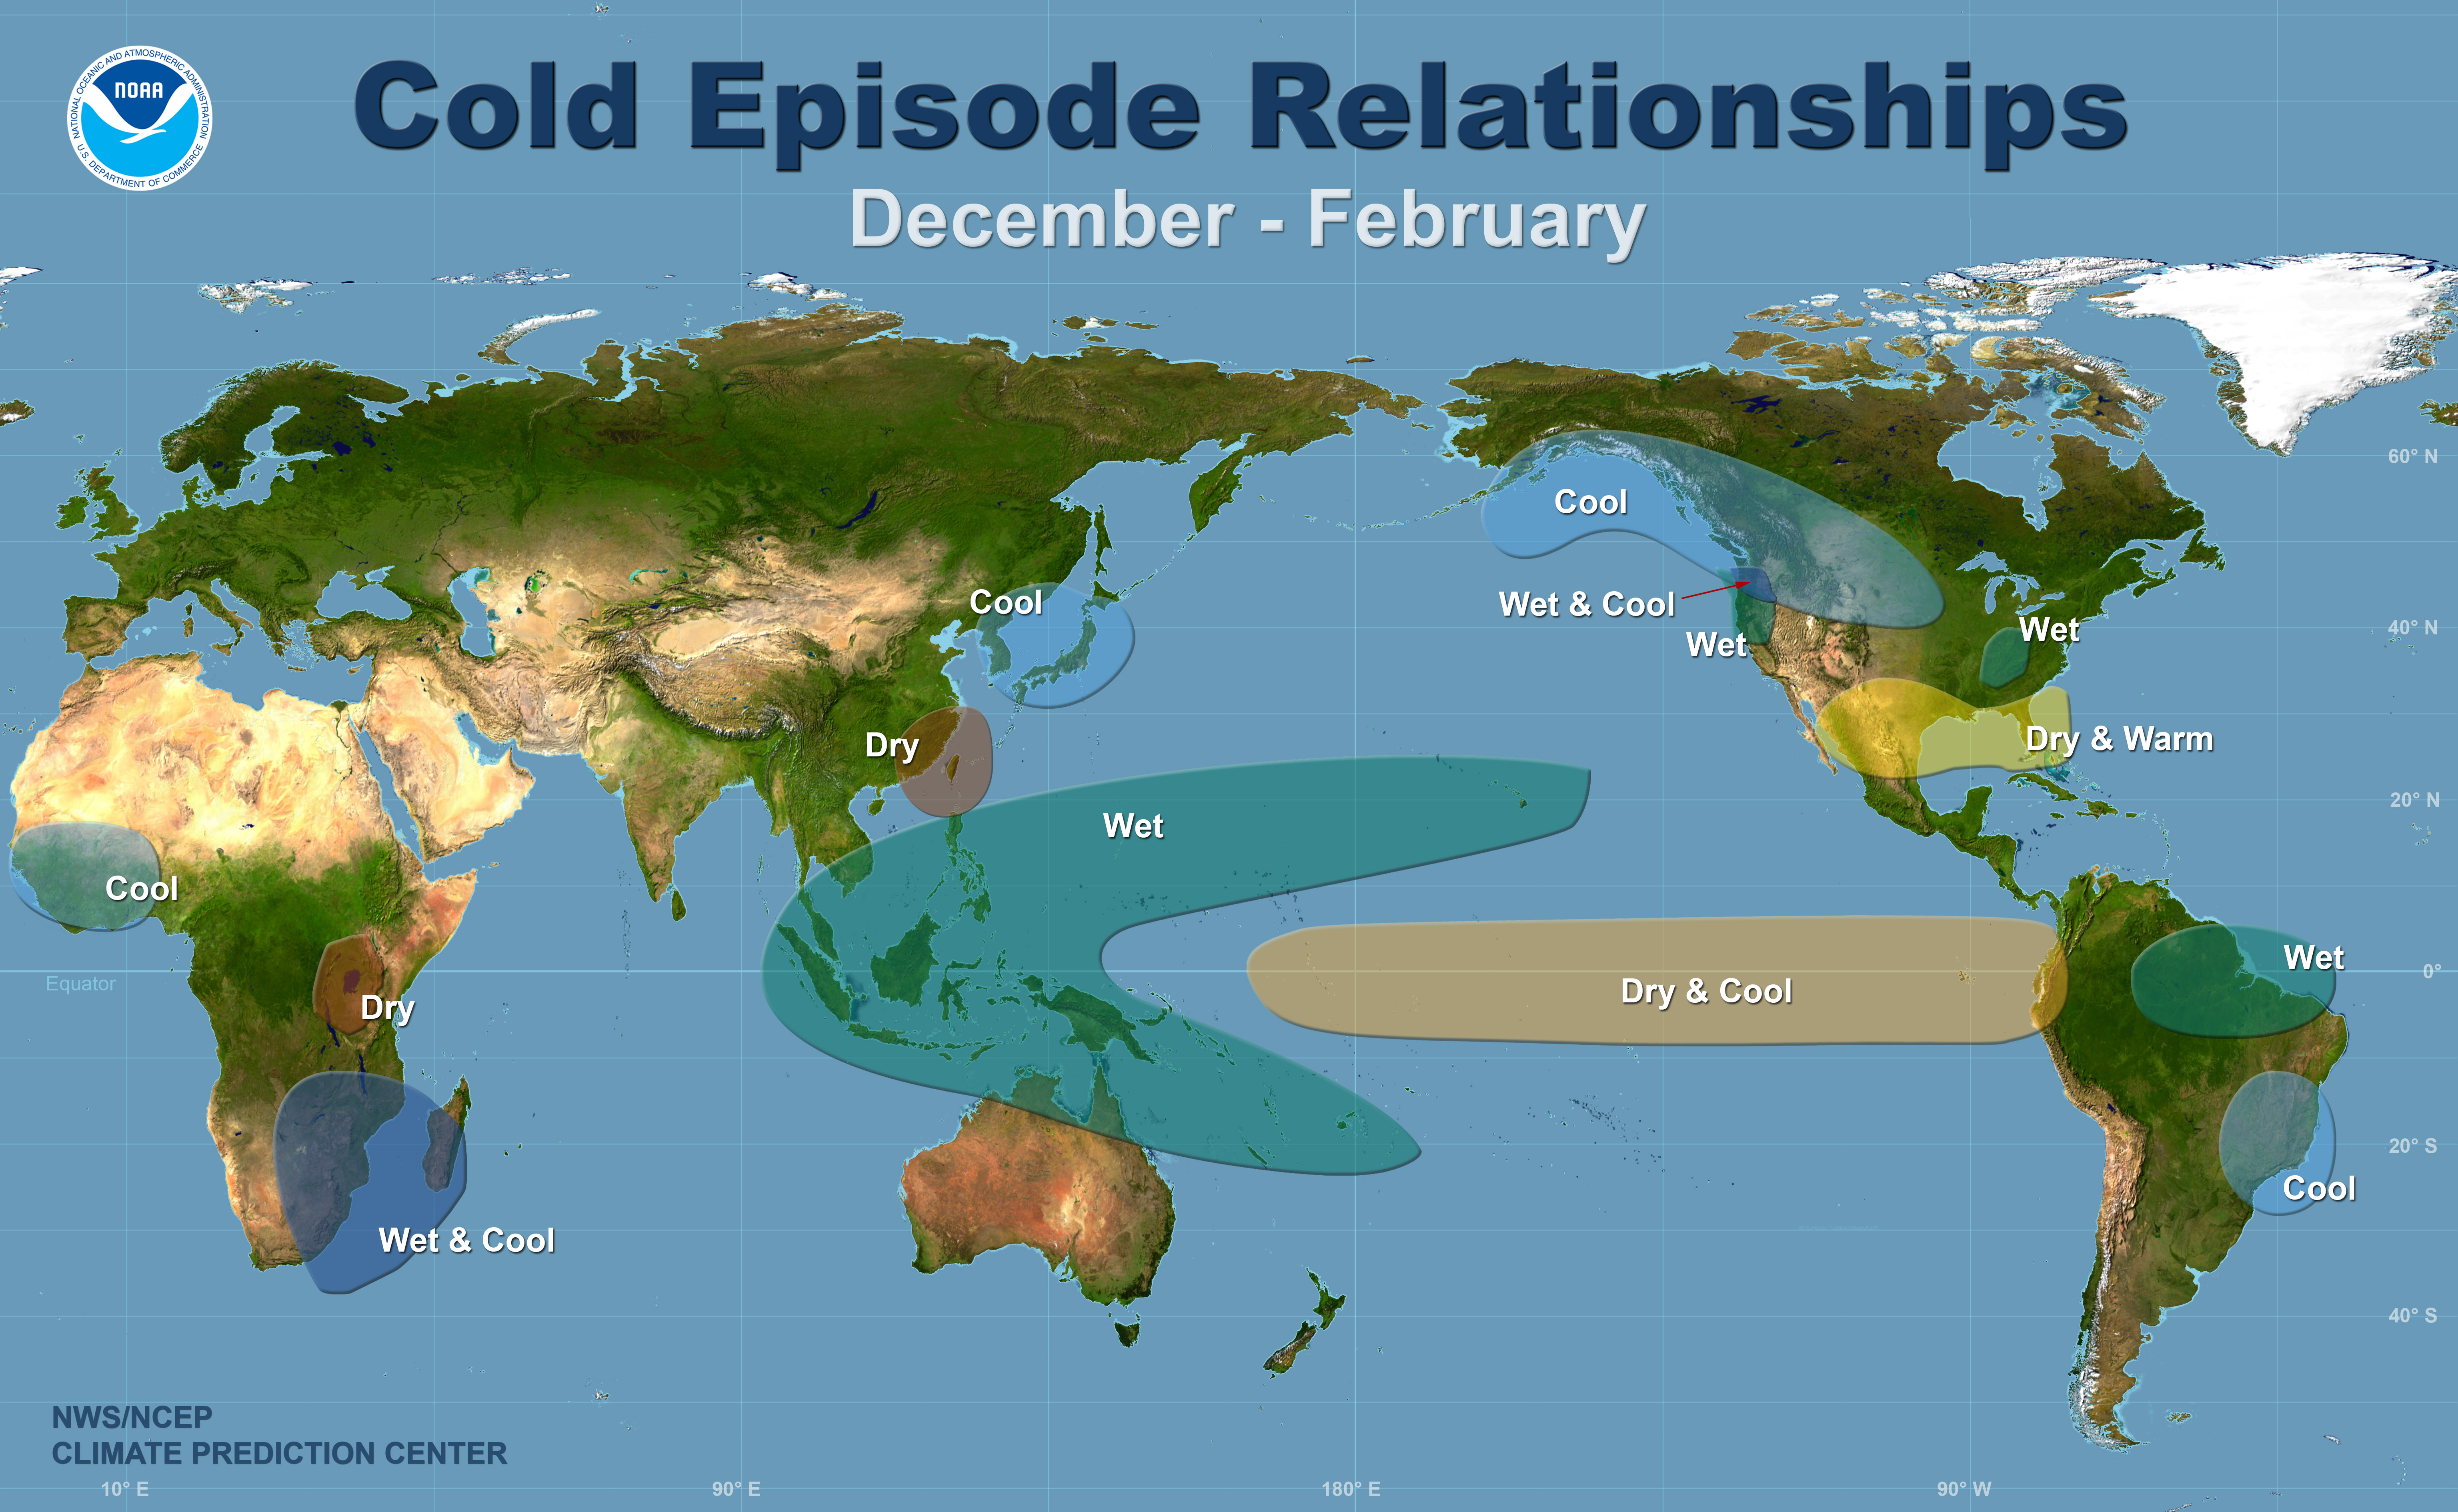
| Above: This map shows the most commonly experienced impacts related to La Niña (“cold episode,” bottom) during the period December to February, when the phenomenon tends to be at its strongest. Image credit: NOAA/NWS Climate Prediction Center. |
For the second winter in a row, La Niña will be in the driver’s seat. The NOAA/NWS Climate Prediction Center issued a La Niña Advisory on Thursday morning, declaring that La Niña conditions were now in place in both the atmosphere and ocean. NOAA gives odds of around 65-75% that La Niña conditions will extend at least through the upcoming Northern Hemisphere winter of 2017-18.
To qualify as ongoing La Niña conditions, sea-surface temperatures (SSTs) across a region in the eastern tropical Pacific defined as Niño3.4 must be at least 0.5°C below the seasonal average, with accompanying changes to the atmospheric circulation. For an El Niño, the SST departure must be at least 0.5°C above average. To qualify as an El Niño or La Niña episode in the historical record, these conditions must be sustained for at least five overlapping three-month periods.
As recently as June, long-range forecasts were leaning more toward El Niño vs. La Niña for 2017-18, but such forecasts are often challenging until after the “spring predictability barrier.” Climatologically speaking, it’s not too much of a shock that La Niña is back with us. La Niña events often linger or recur for two northern winters in a row, sometimes even three. In contrast, El Niño events—especially the strong ones—are often one-year affairs, intensifying in northern autumn and dissipating the next spring or summer.
The La Niña of 2016-17 was a marginal event, just long-lived enough to qualify as a La Niña and never even reaching moderate strength. In fact, it’s the only La Niña event in NOAA records going back to 1950 where three-month average SSTs in the Niño3.4 region failed to even get as cool as 0.8°C below average. The current La Niña is expected to be another weak one.
 |
| Figure 1. The official ENSO (El Niño–Southern Oscillation) probability forecast, based on a consensus of forecasters at the NOAA/NWS Climate Prediction Center and the International Research Institute for Climate and Society (IRI). This outlook is updated during the first half of each month, in association with the official CPC/IRI ENSO Diagnostic Discussion. It is based on observational and predictive information from early in the month and from the previous month. Image credit: CPC/IRI. |
La Niña's U.S. signature: frequent ups and downs, active storm track
The atmospheric rearrangements triggered by La Niña often lead to a consolidated jet stream over North America and an active, progressive storm track. Typically, this leads to periods of roller-coaster weather, with frequent ups and downs in temperature. For the season as a whole, La Niña winters tend to end up colder than average toward the north central and northwest U.S. and warmer than average toward the south and southeast. On top of this is the overall warming influence from human-produced greenhouse gases, which can help reinforce the southern warmth and blunt the northern cold.
As we discussed last month, the plot thickens when we bring in the North Atlantic Oscillation, a semi-cyclic pattern in atmospheric pressure. At The Weather Company, chief meteorologist Dr. Todd Crawford and colleagues have drilled down to see if there’s anything we can deduce on how the NAO might co-evolve with La Niña this autumn and winter. Figure 2 shows a striking difference in month-by-month outcomes during La Niña when the NAO averages negative (center row) versus when it averages positive (bottom row).
The cold signal from La Niña tends to materialize over the Pacific Northwest by February. However, as seen in Figure 2, there can also be pronounced colder-than-average weather across the Midwest and Northeast from late autumn into early winter if the NAO is negative (center row).
 |
| Figure 2. Provided that a La Niña is in place, U.S. winters tend to be much colder when the North Atlantic Oscillation is negative (center row) than when the oscillation is positive (bottom row). Image credit: NOAA/NCEI graphics, courtesy Dr. Todd Crawford, TWC. |
Based on these and other signals, The Weather Company has been leaning a bit more than NOAA toward a chance of early-winter Arctic outbreaks causing colder-than-average conditions over the U.S. Midwest and Northeast. This weekend, a quick blast of unusually chilly air for early November will be pushing across the region. A few daily record lows are possible Saturday morning, according to weather.com. Candidates include New York City (old record 28°F in 1933), Boston (24°F in 1911), and Washington, D.C. (old record 26°F in 1973).
Wintry holiday season ahead for the East Coast?
Looking further ahead, long-range models are suggesting a more prolonged push of cold, stormy weather may unfold in the 7- to 14-day period across much of the Northeast. This is in conjunction with a jet-stream-blocking pattern predicted to unfold as the NAO turns strongly negative.
TWC’s Crawford recently examined the predicted drop in the NAO and found two noteworthy November analogs, both of them during La Niña years: 1950 and 2010. In both cases, strong high-latitude blocking extended into December, and colder-than-average weather dominated the eastern U.S. “Evidence continues to mount that early winter will be cold in the major energy demand regions of the eastern U.S. and western Europe,” said Crawford in an update to clients on Tuesday.
Most Northeasterners will remember the winter of 2010-11 for the onslaught of snowy storms that struck from late December into early February, including the massive Groundhog Day blizzard of Jan. 31-Feb. 2. But late 1950 jumps out because of the Great Appalachian Storm of November 1950, which struck just after Thanksgiving. This intense cyclone resulted in brutal cold, all-time low barometric pressure, and extremely high winds across many parts of the Great Lakes and Northeast. Much of eastern Ohio got walloped with 20 – 30” of snow; Asheville, NC, dipped to 1°F; and major flooding occurred in eastern Pennsylvania. Winds gusted to 108 mph at Newark, NJ, and 160 mph at Mount Washington, NH. This was the most expensive storm on record for U.S. insurance companies up to that point.
 |
| Figure 3. At Ohio State University, Michigan’s Harry Allis kicks the extra point after the only touchdown in the 1950 Snow Bowl. The game, played on November 25 in one of Ohio’s worst snowstorms on record, was among the most wintry installments to date in the Michigan–Ohio State football rivalry. The temperature was reportedly 10°F, with winds gusting to 28 mph and snow falling at up to 2” per hour. Michigan won the game, 9-3. Image credit: Wikimedia Commons. |
La Niña may boost the odds of an active Atlantic hurricane season in 2018
If La Niña conditions were to persist into summer, they could raise the odds of a busier-than-average hurricane season in 2018. La Niña favors rising motion across the Caribbean and tropical Atlantic, and in these areas it tends to reduce the westerly wind shear that can make it harder for tropical cyclones to get organized. That said, there is virtually no skill to hurricane seasonal outlooks this far out, since many variables are involved that can’t be predicted well in advance. Note that the hyperactive 2005 Atlantic season unfolded just a few months after the weak El Niño of 2004-2005!
Colorado State University no longer issues hurricane outlooks for the coming year in December, but it typically releases a “qualitative discussion” highlighting some of the factors to watch going forward.
, from 1895 to 2017.") |
| Figure 4. Temperatures averaged for September-October across the Northeast U.S. as defined by NOAA/NCEI (see map at lower left), from 1895 to 2017. Image credit: NOAA/NCEI. |
Autumn thus far: Warmest on record for the Northeast
The switch to cold weather will be a jarring transition for Northeasterners who’ve been experiencing their warmest autumn on record. For the first two months of meteorological autumn (Sep-Oct), the average temperature across the U.S. Northeast from Maryland to Maine was 59.4°F. That’s the warmest in 123 years of recordkeeping (see Figure 4 above) according to NOAA’s National Centers for Environmental Information.
October was especially mild across New England, where all six states (Connecticut, Maine, Massachusetts, New Hampshire, Rhode Island, and Vermont) saw their warmest October on record. Nationwide, 2017 is the third warmest year on record thus far—and it’s the wettest on record in Michigan, which also had a record-wet October.
Weather.com’s Jonathan Erdman and Linda Lam have more details from NOAA's October U.S. climate report.
 |
| Figure 5. Can you find the former tropical storm? Post-Tropical Cyclone Rina was virtually unrecognizable in this infrared satellite image from 11:15 am EST Thursday, November 9, 2017. Image credit: NOAA/NESDIS. |
TS Rina is no more
Tropical Storm Rina was reclassified by the NOAA/NWS National Hurricane Center as a post-tropical cyclone at 10 am EST Thursday. Although Rina still packed top sustained winds of 45 mph, it was rapidly being absorbed by a cold midlatitude front and strong jet-stream winds moving off the east coast of North America. What’s left of Rina was located at a chilly latitude of 47°N, about 360 miles east of Cape Race, Newfoundland, racing northeast at 45 mph.
NHC hurricane specialist Eric Blake included a fitting postscript in his final forecast discussion on Rina: “Hopefully Rina will be the finale of the extremely active 2017 Atlantic hurricane season. However that might be wishful thinking since, of the top 10 most active hurricane seasons before this year, seven of them still had another tropical storm after today's date.”
Dr. Jeff Masters reviewed the likelihood of one or more additional Atlantic storms over the coming few weeks in a Cat 6 post on Wednesday.


#/media/File:Harry_Allis_extra_point_in_1950_Snow_Bowl.png)