| Above: Towering cumulus clouds build along a dryline in southeast New Mexico, photographed looking eastward on May 25, 2009. Shallower cumulus clouds can be seen in the moist air mass toward the back of the image. Photo credit: Robert Henson. |
In most U.S. springs, there’s a particular week that produces way more than its share of tornadoes, large hail, high wind, and other severe weather. Next week could be that week for the year 2017 thus far. (Not that this week has been storm-free: 26 tornadoes were reported for May 7 – 11, and a tornado-warned storm was moving across the New Orleans area late Friday morning.)
Climatology is friendly to severe storms in May, and the factors that make it so are all expected to be on hand at various points next week, especially across southern Tornado Alley—Kansas, Oklahoma, and Texas.
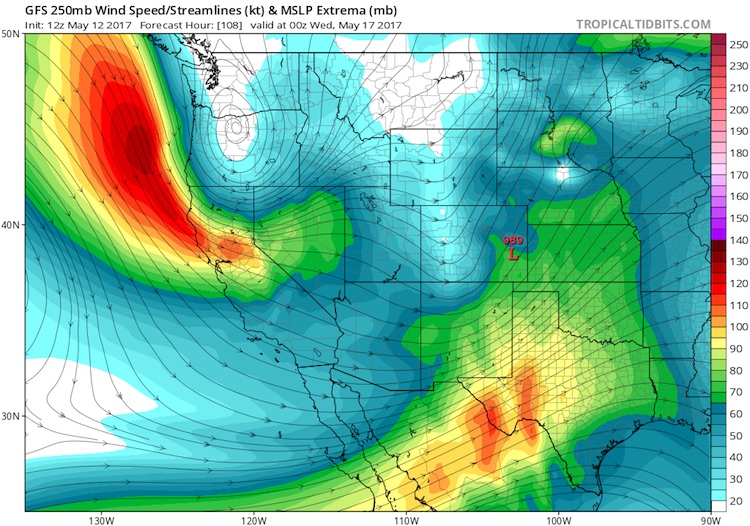
• A strong Pacific jet stream will carve out a deep upper low across the western U.S. early next week. Two main pieces of upper-level energy rotating around the trough will get lobbed eastward into the center of the country. One of those lobes is expected to trigger the first round of severe weather on Tuesday and Wednesday, as noted in the long-range convective outlook from the NOAA/NWS Storm Prediction Center issued Friday morning. All storm hazards, including tornadoes, are possible in the outlooked area (see Figure 2 below).
Models bring the other sharp wave into the Plains later in the week, though they haven’t yet come into agreement on the location and timing.
 |
| Figure 1. Winds at the 250-mb level (about 34,000 feet above the surface) will be spinning around deep low pressure in the northwestern U.S. on Tuesday evening, as depicted in this forecast from the 12Z Friday run of the GFS model. Severe weather may erupt on Tuesday beneath the upper-level wave shown across the Southern Plains, while a second wave (near the West Coast in this image) will sweep in by late week. Image credit: www.tropicaltidbits.com. |
 |
| Figure 2. Severe weather outlook for Tuesday, May 16, 2017, as issued by the Storm Prediction Center on Friday morning, May 12. The yellow area shows where the probability of getting severe weather within 25 miles of any given point is at least 15%. As the event draws closer, these probabilities will be refined; they are often boosted within certain areas if the large-scale forecast holds. Image credit: NOAA/NWS/SPC. |
During each of these episodes, strong southwesterly flow at upper levels will contribute to ample wind shear. That should give at least some storms a chance to rotate and produce a full range of severe weather.
• Plenty of unstable air should be on hand, the result of deep tropical moisture streaming northward into the central United States beneath the advancing upper-level flow. Only a few days ago, some of the richest atmospheric moisture on record for the end of April helped generate flood-producing rains over Missouri and Arkansas.
Sea surface temperatures in the Caribbean Sea are running 0.5°C to 1°C (1°F - 2°F) above average, as they have for weeks. This will enhance evaporation into the air masses streaming north toward the Plains. (The western Gulf of Mexico, which had been much warmer than average for months, has cooled back to near-normal levels.)
• Moisture is essential to severe storms, but extreme levels of moisture through the entire atmosphere can hinder the isolated supercell thunderstorms that produce the most violent tornadoes. That type of storm thrives on a very particular sandwich of atmospheric layers: a warm, moist layer in the first mile or so above the surface, capped by a warm, shallow inversion within the next mile or so, and then topped by a much colder air mass extending vertically for a few more miles. The contrast between the cold top and warm, moist base of the sandwich makes the atmosphere unstable, prone to violent overturning. But if the “cap” in between is especially warm and stable, it keeps the layers separated: bubbles of unstable air can’t rise through it, and the day may pass without any thunderstorms at all.
The setup most prone to lead to tornadic storms is a cap just strong enough to keep storms at bay until afternoon, when the day’s surface heating can allow for a few scattered cells to punch through the cap and develop explosively. It looks as if next week’s pattern will yield at least some capping, though the strength of a cap can be tough for computer models to predict with the needed precision. Sometimes the cap strength remains unclear until the morning of a severe weather day.
Drylines: a mini-explainer
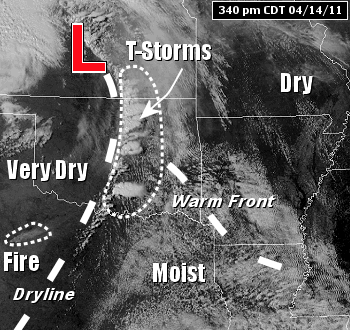
There’s one more ingredient often in the mix for severe weather in the Southern Plains: the infamous dryline. It’s similar in some ways to a cold or warm front, but defined by differences in density and moisture (as its name implies) rather than temperature. Drylines often serve as a focus for thunderstorm development when the conditions are otherwise ripe.
 |
| Figure 3. Thunderstorms forming along a dryline in central Oklahoma at 3:40 pm CDT on April 14, 2011. On standard weather maps, the dryline is depicted by hollow semicircles outlined in brown. Image credit: NWS/Little Rock, AR, via Wikimedia Commons |
A classic dryline features warm, moist air on its east side and warm but far drier air on its west side. It’s a near-vertical boundary, typically extending a mile or so from ground level. Even higher up, the warm, dry air sweeps eastward atop the moist layer, leading to the “cap” discussed above. The west-to-east downward slope of the Great Plains landscape helps accentuate the dryline, with the moist air behaving somewhat like the water in a shallow pool. A cross section through the dryline would show what meteorologists call a solenoidal circulation, where variations in pressure and density intersect to push the boundary one direction or the other at different times of day (much like a sea breeze).
If a slow-moving upper pattern takes hold in late spring, the dryline can “slosh” back and forth—advancing eastward in the afternoon, as daytime heating mixes out the edges and top of the moist air, then retreating westward by late evening, as the dry push weakens and the moist air recovers and deepens once again. A late-night low-level jet stream often assists in this re-moistening process, with southerly winds howling at 60 mph or more just a mile above the ground.
"The ability to correctly forecast the exact dryline position is so important because of its role in initiating severe storms," said researcher Adam Clark (National Severe Storms Laboratory) in an email. "For example, in central Oklahoma a relatively small shift in dryline location could mean Oklahoma City metro having a significant risk of tornadoes versus having no risk at all."
The feel of a dryline
On a typical spring afternoon, you might see hazy blue skies and cumulus clouds east of the dryline, with towering cumulus near the dryline and a bone-dry sky behind it (sometimes with a dull copper tint produced by blowing dust). A passing dryline may boost the temperature by a few degrees Fahrenheit, but it’s the sudden dryness you notice right away.
The sharpness of the dryline’s moisture divide wasn’t fully appreciated until the first VORTEX experiment (1994-95), which sent instrument-mounted vehicles on forays back and forth through drylines in the Southern Plains. A follow-up study in June 1999 found a dryline segment in the Texas Panhandle where the dew point varied by 10°C (18°F) across just 185 meters. That’s 600 feet, or less than two city blocks! Depending on temperature, such a contrast could spell the difference between a relative humidity of 60% and 30%. Values below 15% can sometimes occur just west of a strong dryline.
Drylines are found across the globe, but their prime U.S. hangout is the Great Plains, where they appear on about a third of all spring days, most often in the second half of May. The sharpest U.S. drylines occur when a strong west or southwesterly jet stream is crossing the Rockies. In this setup, surface low pressure tends to form east of the mountains. Sultry air is often streaming northwestward from the Gulf of Mexico toward the low, while desert-toasted air approaches from the southwest beneath the jet stream. Where the air masses meet, the dryline sharpens up.
When there’s a distinct streak of high winds in the jet stream, it can force the dryline to bulge eastward beneath it. Forecasters watch closely for this, because dryline bulges are notorious trigger points for severe-storm development.
If next week’s large-scale setup evolves as expected, we could see some very stout drylines (see Figure 4 below).
 |
| Figure 4. The GFS model run from 12Z Friday, May 12, 2017, predicts a sharp dryline across far western TX/OK/KS at 00Z Wednesday, May 17 (7:00 pm CDT Tuesday). Numbers and colors correspond to surface dew point, a measure of atmospheric moisture, in degrees Fahrenheit. A possible dryline bulge is evident in far southwest Oklahoma. Image credit: www.tropicaltidbits.com. |
Even on days in between strong upper-level forcing, severe storms may still develop near the dryline, as long as southwesterly flow prevails and there is not too much large-scale suppression. Dr. Chuck Doswell recalled such a sequence in his history of early storm-intercept research at the University of Oklahoma and the National Severe Storms Laboratory. “In May of 1977, the teams went out seven days consecutively, an episode that came to be known among the participants as ‘Seven Days in May’ after the movie of the same name,” wrote Doswell. An F2 tornado struck eastern parts of the Oklahoma City metro area on May 20, 1977. It was part of a batch of 16 Oklahoma tornadoes that were among the best-observed and most heavily studied prior to the VORTEX experiments.
Pinning down the dryline, automatically
With the advent of high-resolution mesoscale forecast models, it’s becoming easier to track and predict fine-scale behavior of the dryline, including bulges and other features. However, even the most precise models can struggle to predict the very-small-scale features that influence the motion of dryline segments.
Adam Clark is among the researchers who have worked on an automated technique created by OU graduate student Andrew Mackenzie that successfully identifies and tracks drylines in NSSL’s high-res version of the WRF model. Using machine learning concepts, Clark and colleagues have already corrected much of the over-detection that cropped up in the initial algorithm. Such products could be a boon for efficiently analyzing drylines within huge model data sets, which could advance both long-term research and short-fuse forecasting. "This is also something that could be applied to climate models to diagnose potential changes to the dryline location later in the 21st century," Clark added.


