| Above: Tropical Storm Emily making landfall south of Tampa, Florida as seen by the experimental GOES-16 satellite imagery at 11:32 am EDT July 31, 2017. Image credit: College of DuPage. |
Well, that was fast. NOAA Doppler weather radar data and surface observations indicate that Tropical Storm Emily made landfall with peak sustained winds of 45 mph at 10:45 AM EDT (1445 UTC) Monday on Anna Maria Island, just west of Bradenton, Florida. Emily spun into life on Monday morning at 8 am EDT just off the Gulf Coast of Florida. Emily’s formation came just 48 hours after receiving no mention at all as a possible threat in the National Hurricane Center’s 8 am Saturday Tropical Weather Outlook. Emily erupted along the Gulf of Mexico portion of a cold front that had pushed over Florida during the weekend, and took full advantage of very warm water temperatures near 30°C (86°F). Development was not expected due to high wind shear of 20 – 30 knots, plus very dry air at mid-levels of the atmosphere, where the relative humidity was near 45%. Emily formed so quickly and unexpectedly that the Hurricane Hunters never flew into the storm. It is very unusual for a named storm to make landfall in the U.S. without the Hurricane Hunters ever sampling the storm.
 |
Figure 1. Tropical Storm Emily near the time of landfall in the Tampa Bay, Florida region, at 11:23 am EDT July 31, 2017, as seen by the Tampa radar. |
Top winds from Emily on Monday morning from buoys in the Tampa Bay area were 39 mph, gusting to 45 mph, at 10:42 am EDT at the Middle Tampa Bay buoy. Heavy rains are the main threat from Emily, and an Areal Flood Watch is posted for much of Central Florida, including the Tampa Bay area, for 3 – 6” of rain. Storm surge damage from Emily will be minimal; the storm surge peaked at around 1 foot in Tampa Bay around 11 am EDT, and was 1.3 feet at Fort Myers at 11:30 am.
Forecast for Emily
The forecast for Emily is very straightforward, with the models agreeing on a path across Central Florida Monday afternoon and evening, then into the waters off the east coast of Florida by Tuesday morning. Passage over Florida will reduce Emily to a tropical depression tonight, but the storm should be able to regain tropical storm status over the warm waters of the Gulf Stream by Tuesday night. However, Emily will be several hundred miles offshore from the Southeast U.S. coast Tuesday and Wednesday, with the core of the storm’s heavy rains staying well out to sea.
Emily’s place in history
Emily’s formation date of July 31 comes a full month before the average August 31 date of the season’s fifth named storm. The record earliest appearance of the season’s fifth named storm came on July 11, 2005, from a storm also named Emily. The 2017 version of Emily will be the second tropical storm to make landfall in the U.S. this year; Tropical Storm Cindy made landfall in Southwest Louisiana on June 22, bringing heavy rains, sustained winds of 45 mph, and a peak storm surge of 4 feet. Cindy killed two and caused less than $5 million in damage, according to insurance broker Aon Benfield.
Quiet elsewhere in the Atlantic
A tropical wave in the central tropical Atlantic, midway between the Lesser Antilles Islands and Cabo Verde Islands on Monday morning, was being given 5-day odds of development of 10% by NHC in their 8 am Monday Tropical Weather Outlook. Satellite images on Monday morning showed that dry air was keeping heavy thunderstorm activity to a minimum with this tropical wave, as it headed west to west-northwest at 10 – 15 mph. The 0Z Monday runs of our top models for predicting tropical cyclone genesis--the GFS, UKMET and European models—did not show development of this wave over the coming five days, and the 70 ensemble members of the GFS and European models showed very limited support for development, mostly because of dry air.
The European model was more bullish on developing a tropical wave predicted to come off the coast of Africa on Wednesday night. The 0Z Monday run of the model predicted development occurring early next week in the Central Atlantic, as the wave moved west towards the Lesser Antilles Islands. The 12Z Monday run of the GFS model also supported this idea, but it is too early to assign a probability of development.
 |
| Figure 2. Infrared satellite image of Typhoon Noru at 1230Z Monday, July 31, 2017. Image credit: University of Wisconsin-Madison/CIMMS. |
Super Typhoon Noru zooms to Cat 5 status in Northwest Pacific
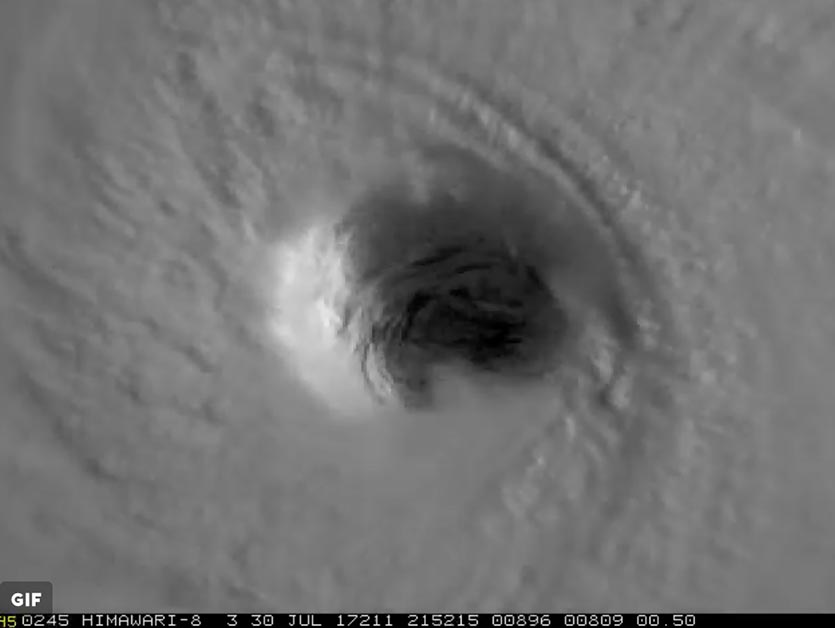
Earth’s first Category 5 storm of the year developed in spectacular fashion on Sunday. Super Typhoon Noru strengthened incredibly quickly over the weekend after having drifted southward over the Northwest Pacific—an unusual track for a rapid intensifier, as pointed out by Eric Blake (NHC). The southward motion brought Noru over very warm waters close to 30°C (86°F), and wind shear dropped below 10 knots over the weekend. A nearby subtropical jet stream helped to ventilate the typhoon and facilitate rapid strengthening.
Even though the atmosphere around Noru was not exceptionally moist, the system intensified at a near-record pace as measured by 1-minute top sustained winds. Noru zoomed from tropical storm status at 0Z Sunday (60 knots) to Category 5 strength at 18Z Sunday (140 knots). Fast-growing Hurricane Matthew accomplished the same feat in the Atlantic last year, but it took 36 hours rather than just 18 hours. The Atlantic’s fastest intensifier on record was Wilma in 2005, which went from tropical storm to Cat 5 status in 24 hours.
As of 12Z GMT (8 am EDT) Monday, the Joint Typhoon Warning Center pegged Noru’s winds at 145 mph, Category 4 strength. Noru remained a formidable typhoon, with an annular structure becoming more prominent over time (a single broad ring of intense thunderstorms around a fairly large 17-mile-wide eye).
Japan will need to watch Noru closely, although there’s plenty of time to do so. Noru will be heading northwest over the next several days, weakening as it passes over somewhat cooler water. It’s expected to stall late this week southeast of Japan, as steering currents slacken in the wake of an upper-level trough passage. Models have been all over the map on where Noru heads after that point—including model ensembles, such as the European. However, it appears a subsequent upper-level trough may pull Noru toward Japan. The 00Z European and 06Z GFS operational runs both show the potential for Noru to strike Japan as a very powerful typhoon about a week from now.
Dan Lindsey’s Twitter feed (@DanLindsey77) has a spectacular close-up satellite loop of Noru collected at sunrise Monday, with several mesoscale vortices twirling around the eye. This imagery comes from the high-resolution Himiwari-8 satellite. NOAA’s new GOES-16 has comparable resolution, so we might get a similar breed of eye-popping images should we end up with any hurricanes this strong in the Atlantic in 2017.
 |
| Figure 3. Himiwari-8 visible satellite image of Typhoon Noru’s eye at 2152Z Sunday, July 30, 2017, shortly after it attained Category 5 status. Image credit: CSU/RAMMB/CIRA via Dan Lindsey. |
 |
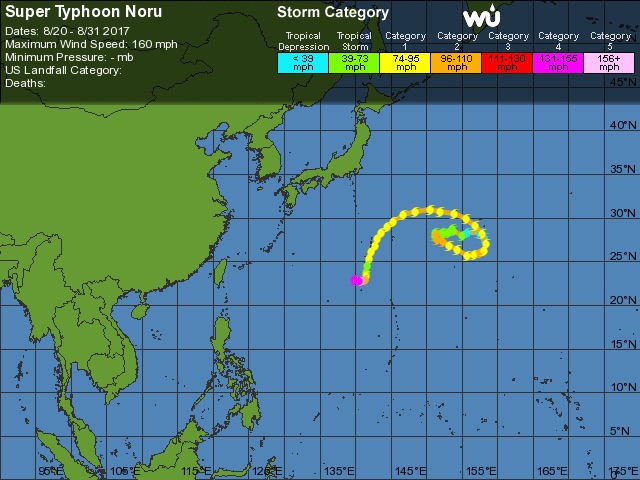
| Figure 4. WU tracking map for Typhoon Noru, which was already a long-lived storm before it rocketed to Category 5 status on Sunday. Noru originated as a tropical depression on July 20 and intensified to Category 2 status (100 mph) by July 23, then weakened gradually as it carried out a tight cyclonic loop followed by a broader arc southward over the following week. |
Bob Henson co-wrote this post.


