Summer is finally here, bringing ice pops, kickball games, Hawaiian shirts, and campfire songs. Camp counselors know what this means: 100°F-degree days where the ten-foot walk to the storage shed to grab basketballs leaves you drenched in sweat. It seems like there’s no way to escape the summer-time heat…or is there?
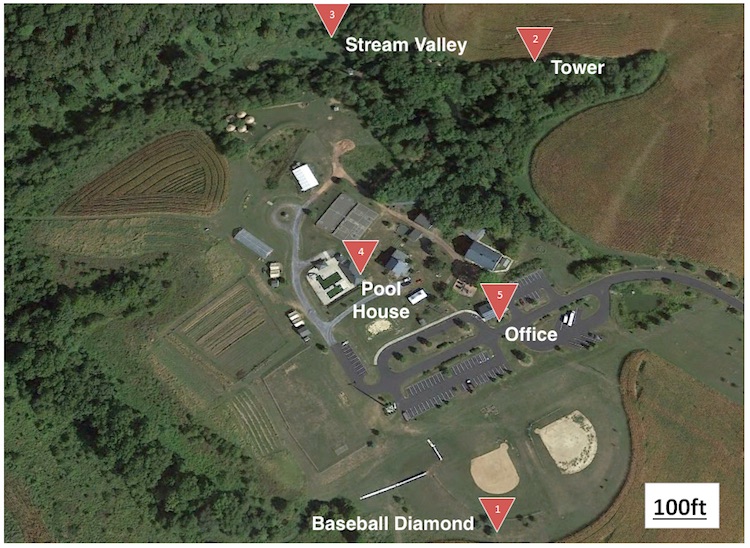
Surroundings like trees, buildings, pavement, and topography can impact the weather on a very small scale, making the temperature feel different from place to place. As a camp counselor in Maryland and an atmospheric science student, I always knew that children in my group could get a reprieve from the heat and humidity by heading to the wooded stream valley to build tree forts. Measuring the temperature difference between the hot center of camp and the cooler woods 600 feet away inspired me to build a five-station weather network for my summer camp.
 |
| Figure 1. The five-station network deployed at a summer camp in Maryland. Image credit: Tyler Boyle. |
 |
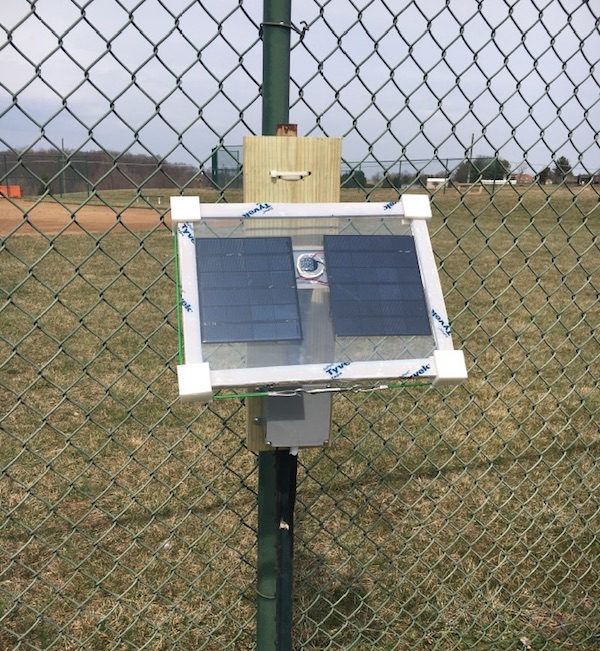
| Figure 2. Station 1, deployed near a baseball diamond on the south side of the campground (photographed in March). Image credit: Tyler Boyle. |
Each station was personally designed to fit the needs of each location, hand-built by myself using electronics and hardware that can easily be found online, and programmed using modified open-source software. These stations are solar-powered and run off a small computer called an Arduino. They collect temperature, barometric pressure, relative humidity, and UV index year round, forwarding this information through radio frequencies to a base station. All stations are connected through a mesh network, which insures that all weather data is collected and transmitted, even from the most distant locations of camp. Once the data reaches the base station, it is published to the Internet, and can be seen through an iPhone app.
Because these stations are dispersed throughout remote locations of camp where there isn’t access to the Internet, these stations aren’t synced through the Weather Underground network
 |
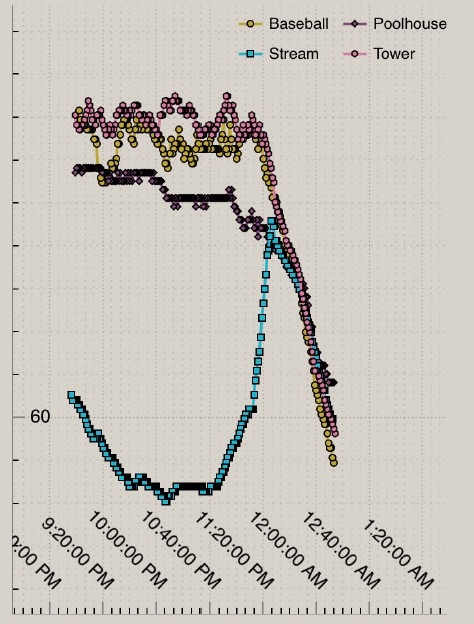
| Figure 3. Temperatures at four of the five micronet stations (degrees F) on the late evening of March 26, 2017. (The "Office" station from Fig. 1 was not yet set up to provide temperatures at this point.) Temperatures were running about 8-10°F cooler in a shallow inversion at the Stream Valley station after sunset. As a cold front moved in, the inversion mixed out and temperatures actually rose at the Stream Valley station just before midnight, before dropping camp-wide in unision. Image credit: Tyler Boyle. |
Large weather networks have many stations distributed over a large area, where stations can be several miles from another one. Smaller weather networks are less common and feature many more stations for a smaller area, allowing them to capture how weather can impact each location differently. This network has five stations to cover an area of about 400 by 700 feet (122 by 213 meters).
The location of each station in Figure 1 represents a distinct microclimate found in the camp. A station at the baseball diamond represents how hot the temperature really is out in the open, while the stream station shows how refreshing it can be in the stream valley. Another station ("Tower") shows us how the shade of the woods can impact the weather, while the pool house station reminds us that it can be incredibly hot around the center of camp. The ultimate tease is the office station, which reminds us that an amenity like air conditioning can be highly enjoyable after a day of camp.
A cold front moves in—and down
Besides telling us that walking on the blacktop without any shoes on is a bad idea, these stations can give us insight into how the unique features of the camp, like the terrain, can impact the weather.
One evening, a cold front rolled through around 11:00 p.m. and sent temperatures at most stations plummeting. At the stream valley, though, the temperature increased as the others fell. Here, the topography impacted the temperature. As the cold front moved through, it pushed the existing warm air into the stream valley (see Figure 3). Eventually, the cold air settled even into the recesses of the stream valley, completing the camp-wide cooldown. In this case, the local topography made a cold front do the opposite of what it’s supposed to do in the stream valley.
This example shows us how weather is not the same everywhere, even across a small campground. Features like clouds and fronts aren’t the only things that can impact the weather: trees, pavement, and even topography play a role in local meteorology too.
Editor’s note: Eugene rockets to major hurricane status in East Pacific
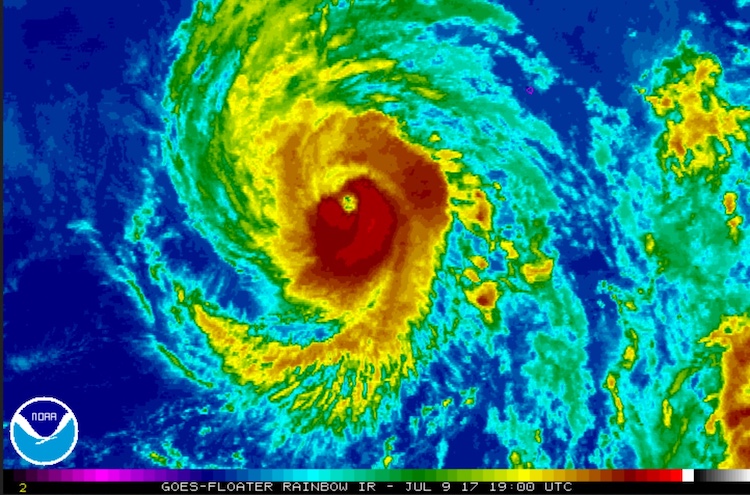
Intensifying far more than expected, Hurricane Eugene reached Category 3 status on the Saffir-Simpson Scale on Sunday morning. As of 11 AM EDT, Eugene was packing top sustained winds of 115 mph, putting it at minimal Cat 3 status. Eugene is the first major hurricane of 2017 in the Western Hemisphere. It’s also the year's first major hurricane in the Northern Hemisphere, as the Northwest Pacific has been exceptionally quiet, with no typhoons recorded so far this season. The last year we went this long without a major Northern Hemisphere hurricane was 1987, according to Phil Klotzbach (Colorado State University).
 |
| Figure 4. Enhanced infrared image of Hurricane Eugene as of 19Z (3:00 pm EDT) Sunday, July 9, 2017. Image credit: NOAA/NESDIS. |
Located about 565 miles southwest of the tip of Baja California at 11 am EDT Sunday, Eugene was moving northwest at 10 mph. Eugene should continue to parallel the coast for the next several days, posing no threat to land. The hurricane is likely near its peak intensity, as its path will take it over much cooler waters within a few hours. The 18Z Sunday run of the SHIPS model shows that sea-surface temperatures beneath Eugene will have dropped from around 27°C (81°F) to around 25°C (77°F) by Monday morning, a reading below the 26°C benchmark threshold to support tropical cyclones. Wind shear will remain very low (less than 10 knots), but a progressively drier atmosphere will contribute to gradual weakening.
We’ll have more on Eugene and on a wave now entering the eastern tropical Atlantic in our Monday update. The latter wave is worth watching closely, as it may pose a threat to the Lesser Antilles by late this week and areas to the west thereafter. —Bob Henson


