| Above: Visible satellite image of Tropical Storm Ophelia at 12:45 pm EDT Wednesday, October 11, 2017. Image credit: NOAA/NESDIS. |
Tropical Storm Ophelia continued its gradual climb toward hurricane status on Wednesday, still far from land and in no hurry to get closer. As of 11 am EDT Wednesday, Ophelia’s top winds were up to 70 mph, just short of hurricane strength. The storm was located in the central Atlantic almost 800 miles southwest of the Azores, drifting east at 3 mph. By Thursday, Ophelia is likely to be the Atlantic’s tenth tropical storm in a row to become a hurricane. Update: At 5:00 pm EDT, the NOAA/NWS National Hurricane Center (NHC) upgraded Ophelia to hurricane status, with top sustained winds of 75 mph. Only three other years have seen ten consecutive Atlantic hurricanes: 1878, 1886, and 1893. (Note that within some of those late-1800s strings, there might have been small, short-lived tropical storms that today’s satellites would have caught.)
Ophelia was looking more organized than ever on satellite Wednesday morning, with a distinct eye surrounded by a moderately large field of banded showers and thunderstorms (convection). “If I only had conventional satellite imagery, I would definitely estimate that Ophelia was a hurricane,” said NHC forecaster Lixion Avila in his forecast discussion late Wednesday morning. However, Ophelia is a “cold” system, with convection that’s quite well organized but not especially intense. That’s because of sea surface temperatures (SSTs) barely warm enough to support tropical development (around 26.5°C, or 80°F), coupled with unusually cold conditions for this time of year in the upper atmosphere. The result is enough atmospheric instability to support convection, but with weaker updrafts given the comparatively cool conditions at all altitudes.
| Figure 1. NHC forecast map for Tropical Storm Ophelia, issued at 11 am EDT Wednesday, October 11, 2017. |
Ophelia could affect the Azores—and even Ireland
Although Ophelia is an unusual storm, the forecast is fairly straightforward. Wind shear will remain in the 10 – 20 knot range through Friday, according to the 12Z Wednesday run of the SHIPS model. Sea surface temperatures will gradually drop along Ophelia’s path, though they will remain near or above 26°C (79°F) until Friday. Even these marginally warm SSTs are about 1°C above average for mid-October. With the overall environment holding fairly constant, Ophelia should be able to reach hurricane strength by Wednesday night. NHC predicts that Ophelia will maintain Category 1 strength until the weekend, at which point it’s expected to transition into a powerful post-tropical (mid-latitude) storm with winds near hurricane strength.
Weak steering currents will keep Ophelia drifting eastward until Friday, when a stronger upper-level storm at midlatitudes begins to accelerate Ophelia toward the east-northeast, eventually arcing north-northeast. On this course, Ophelia would track near or just south of Santa Maria, the southernmost island of the Azores, on Saturday. The 12Z Wednesday run of the GFS model brings Ophelia within about 60 miles of Santa Maria. Assuming that the island remains on the weaker left-hand side of Ophelia, wind impacts would be lessened, but torrential rains and squalls are still possible if Ophelia passes close enough. In NOAA’s historical hurricane database, which extends back to 1851, only 11 hurricanes have passed within about 200 miles of the Azores (as noted by weather.com). Every one of those occurred in August or September—except for strikingly unseasonal Hurricane Alex, which struck the islands in January 2016 just after weakening to tropical-storm strength.
Our top global track models have trended westward with Ophelia’s track from Saturday onward. This reduces the threat of Ophelia reaching the Iberian Peninsula (Spain and Portugal) but raises the risk of strong winds hitting western Ireland. NHC’s 5-day forecast “cone” from 11 am EDT Wednesday (Figure 1 above) includes the rare sight of Ireland falling within the cone, although Ophelia is predicted to be a post-tropical cyclone by that point. However, the transition from hurricane to post-tropical cyclone may be a moot point when it comes to impacts on Ireland: Ophelia would be a powerful storm either way, quickly becoming embedded in an approaching upper-level trough that would inject additional energy into the system.
| Figure 2. WU tracking map for Hurricane Debbie (1961). |
The case of Debbie
There is a rough analog for Ophelia’s potential to affect Ireland. “Of all the Irish windstorms in living memory, Debbie in September 1961 set many records that still stand to this day,” notes Irish Weather Online.
A Cape Verde-type storm that topped out at Category 3 strength, Hurricane Debbie tracked through the western Azores as a Category 1 hurricane, then arced northeast and brushed the west coast of Ireland, apparently not long after having transitioned from tropical to post-tropical (extratropical) cyclone. Debbie passed close enough to Ireland to produce major destruction. Wind gusts topped 100 mph at a number of stations, setting numerous all-time record high speeds. The Shannon airport notched 10-minute sustained winds of 69 mph and gusts as high as 107 mph; at Malin Head, winds were sustained for six hours at or above 62 mph. A surface pressure reading of 961.4 mb was reported at Belmullet, on Ireland’s west coast. Some parts of western Ireland lost nearly 25% of all trees. All told, Debbie took 18 lives in Ireland, plus 60 others from a Debbie-related plane crash in the Azores. Damage in Ireland totaled more than $40 million (USD, 1961 value).
Fortunately, Ophelia is currently projected to stay further off the Irish coast than Debbie did. Let’s hope that trend holds!
 |
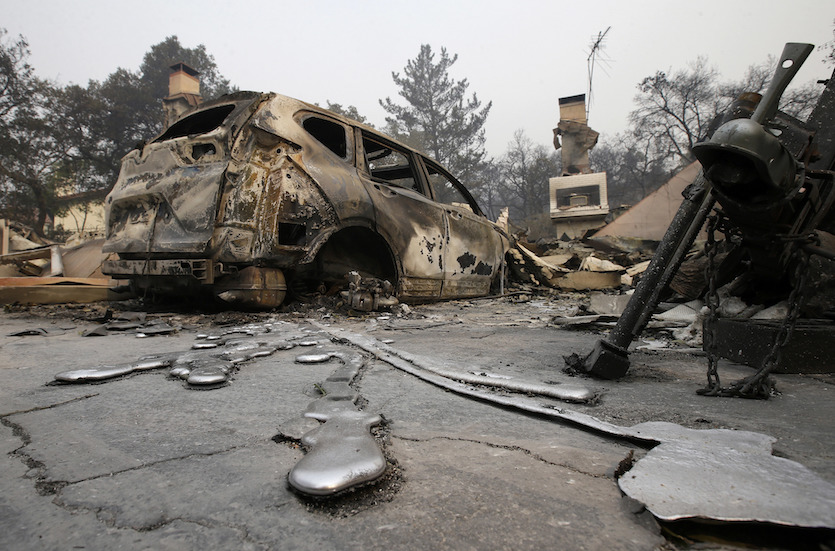
| Figure 3. Rivers of melted metal flow from a vehicle parked at a home, Tuesday, Oct. 10, 2017, that was destroyed by a wildfire near Napa, Calif. Wildfires whipped by powerful winds swept through California wine country sending thousands fleeing as flames raged unchecked through high-end resorts, grocery stores and tree-lined neighborhoods. Image credit: AP Photo/Rich Pedroncelli. |
Dangerous fire weather returning to parts of California
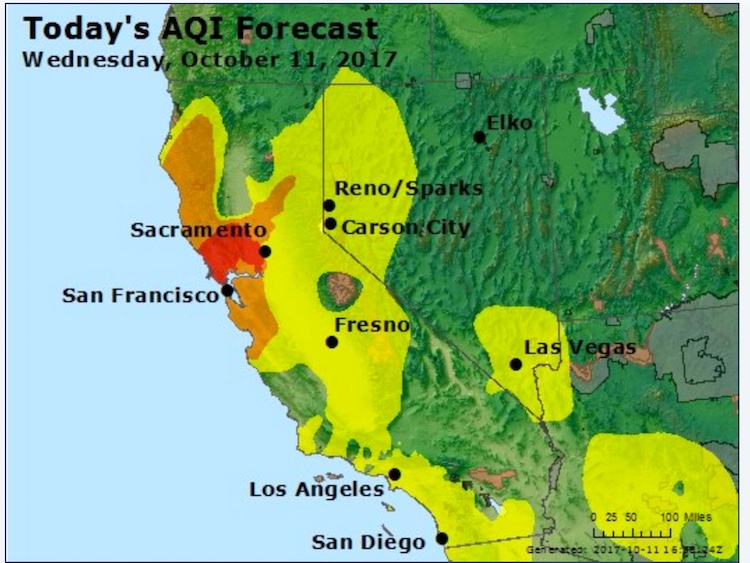
At least 17 deaths have been confirmed in the catastrophic fires that swept across the North Bay region of California on Sunday and Monday. Nearly 170,000 acres have burned, and some 2000 structures have been destroyed. Air quality remains severely degraded at times across many parts of the region, including San Francisco.
The next several days will not be what the doctor ordered for fire relief in California. Although temperatures cooled and winds slackened on Tuesday, a dry frontal system will be pushing up wind speeds late Wednesday into Thursday across the San Francisco Bay region. This includes the fire-scarred North Bay region, which encompasses Santa Rosa and the Napa/Sonoma wine country. The NOAA/NWS Storm Prediction Center is calling for critical fire weather conditions across the region into Thursday morning, and the NWS Bay Area office has issued a red flag warning for higher elevations. The overall atmosphere is cooler than on Sunday/Monday, so the temperature and humidity levels will not be as extreme. Wind gusts in the North Bay area are expected to be in the 45 - 55 mph range at higher elevations, as opposed to the 60 - 80 mph gusts that struck early Monday. However, with fires ongoing and the fuels still tinder-dry, any strong wind would not be good news. Wednesday's winds at higher elevations could still be strong enough to topple trees and power lines and run the risk of igniting new fires.
Unfortunately, there may be yet another round of dangerous fire weather in the Bay Area on Friday/Saturday, with a strong upper-level trough producing a low-level pressure pattern not unlike the one that drove warm, dry winds across the region late Sunday into Monday. Further south, a fire weather watch is in place from late Thursday into Saturday for large parts of the Los Angeles area. Weak to moderate Santa Ana conditions are expected, with northerly winds gusting as high as 45 mph and humidities predicted to drop below 20%. As with the Bay Area, there is plenty of tinder-dry vegetation in place to support extreme/rapid fire growth.
 |
| Figure 4. Unhealthy air is predicted to cover large parts of the North San Francisco Bay region on Wednesday, October 11, 2017. Image credit: EPA/AirNOW. |


