| Above: MODIS image of Harvey taken at approximately 12 pm CDT Friday, August 25, 2017. Image credit: NASA. |
Potentially devastating Hurricane Harvey was upgraded to Category 3 status at 2:00 pm CDT Friday, just a few hours ahead of an expected landfall on the central Texas coast on Friday night. All signs are that Harvey will maintain major-hurricane strength right up to the coast, which would make it the first major hurricane (as defined by Cat 3 or stronger winds) to strike the U.S. since Wilma in 2005. Update: at 6:00 pm CDT, Harvey was upgraded to Category 4 status, with top susatined winds of 130 mph. Harvey will also be the strongest hurricane to make landfall in Texas since Rita, also in 2005. A Hurricane Warning was in effect from Port Mansfield to Sargent, TX, with a Storm Surge Warning from Port Mansfield to High Island. Harvey is expected to slow to a crawl not long after landfall, and it will pose a potentially catastrophic, multi-day flooding threat for large parts of southern and eastern Texas, and potentially southwest Louisiana.
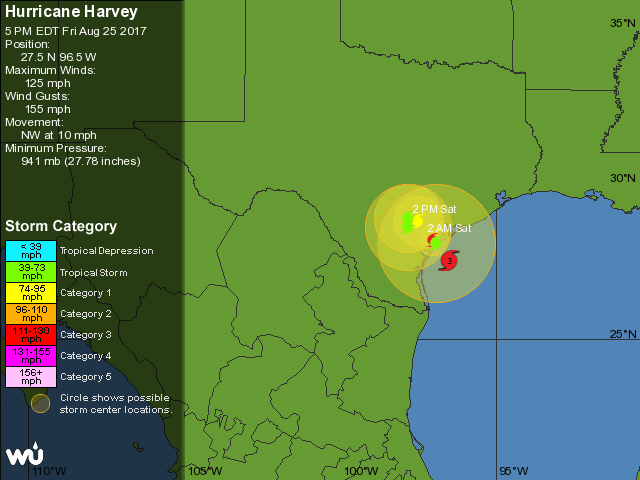
Despite a double-eyewall structure, Harvey was continuing to strengthen late Friday, with a central pressure of 941 millibars and sustained winds of 125 mph in the National Hurricane Center (NHC) advisory issued at 4 pm CDT. Harvey was centered about 60 miles east-southeast of Corpus Christi or about 60 miles south of Port O’Connor, moving northwest at about 10 mph. At 3 pm CDT, tropical storm-force winds were already occurring along the coast of Texas. Some recent observations:
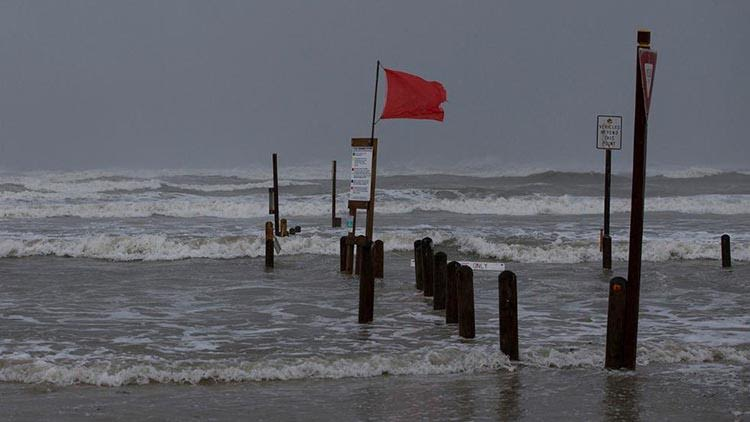
- At 3:36 pm CDT, Corpus Christi Naval Air Station reported sustained winds of 53 mph, gusting to 70 mph.
- At 3:35 pm CDT, Mustang Beach Airport reported sustained winds of 51 mph, gusting to 68 mph.
- At 3:18 pm CDT, Packery Channel reported sustained winds of 54 mph, gusting to 65 mph.
 |
| Figure 1. Radar image collected by NWS at 3:32 pm CDT Friday, August 25. |
 |
| Figure 2. The inside of Hurricane Harvey as seen on Friday morning, August 25, 2017, from an Air Force hurricane hunter C-130 aircraft. Image credit: Lt. Will Simmons, Air Force Hurricane Hunters. |
The most urgent threat on Friday night will be major storm surge and high wind associated with Harvey’s landfall. Harvey is projected by the models to angle slightly to the right as it approaches the coast, which may prolong the period of intense wind and high storm surge east of Harvey’s center, late Friday into early Saturday. Port Lavaca is at particular risk of surge-related flooding, as it sits on the west side of Lavaca Bay just inland from Matagorda Bay. Harvey’s northeast eyewall may reach the coast just southwest of Matagorda Bay and Port O’Connor. If it does, the funneling effects of storm surge along the shallow, concave coast of Texas could be capable of pushing storm surge at Port Lavaca into the 11- to 13-foot range. Harvey will be the strongest hurricane to strike this part of the central Texas coast since Carla (1961), which came onshore near Port O’Connor as a strong Category 4 hurricane and caused extreme damage, with an 18.5-foot surge at Port Lavaca.
Official storm surge forecasts from the 4 pm CDT Friday NHC advisory along the Texas and southwest Louisiana coast include:
- N Entrance Padre Island Natl Seashore to Sargent...6 to 12 ft
- Sargent to Jamaica Beach...5 to 8 ft
- Port Mansfield to N Entrance Padre Island Natl Seashore...5 to 7 ft
- Jamaica Beach to High Island...2 to 4 ft
- Mouth of the Rio Grande to Port Mansfield...1 to 3 ft
- High Island to Morgan City...1 to 3 ft
 |
| Figure 3. Water rises at Bob Hall Pier in Corpus Christi, Texas on Friday, August 25, 2017. At 3 pm CDT Friday, a storm surge of 2.9 feet was measured at the pier. Image credit: Courtney Sacco/Corpus Christi Caller-Times via AP. |
The central Texas coast has a low tidal range, generally less than one foot between high and low tide, so the timing of Harvey’s landfall with respect to high tide will not make as much of a difference as we are usually concerned about with a hurricane landfall. NOAA has a nice “quicklook” page for Harvey that shows graphs of the water levels at gauging stations in the path of Harvey. In addition, our Wundermap with the “Storm Surge” layer turned on will give you a map with the surge values plotted. Below are the observed storm surges along the coast of central Texas, arranged from north to south, as of 3 pm CDT Friday. Note that some locations had a negative surge, because strong offshore winds of the left side of the counter-clockwise circulation of Harvey were pushing water away from the coast:
Galveston, 2.4’
Freeport, 2.2'
Port O’Connor, 1.6’
Port Lavaca, -0.1’
Seadrift, -0.6’
Copana Bay, -0.1’
Rockport, 1.3’
Port Aransas, 2.0’
Corpus Christi, 2.6’
 |
| Figure 4. WU depiction of NHC 5-day outlook for Hurricane Harvey as of 4:00 pm CDT Friday, August 25. The concentric circles indicate how slowly Harvey is expected to move over the next few days. |
After landfall, catastrophic inland flooding becomes more likely
Even though a landfalling Category 4 hurricane is a serious threat in itself, an even greater risk from Harvey is the colossal amount of rain that models indicate it will dump across the southeast third of Texas. Steering currents will collapse during the weekend, leaving Harvey stranded somewhere near the central Texas coast or perhaps just inland for what could be several days. If anything, model guidance is stronger than ever on the notion that Harvey will stall for the better part of a week. The official NHC forecast issued at 4 pm CDT Friday weakens Harvey to tropical storm strength on Saturday, but keeps it within about 100 miles of Port O’Connor for the entire period through Tuesday, finally moving it slowly northeast toward the Houston area by Wednesday. There is virtually no precedent for such a slow-moving system maintaining at least tropical storm strength along the Texas coast for five days. Whether or not Harvey maintains tropical storm strength will depend in large part on how close its center drifts to the coast. Regardless of its status, Harvey’s slow movement and huge amounts of moisture will lead to enormous rainfall and will likely produce vast areas of flooding.
Coastal Texas and Louisiana are among the wettest places in the United States. We know that the right conditions can produce rainfall measured in feet across this area. The heaviest 24-hour rainfall in U.S. records is the 42” observed in Alvin, TX (just south of Houston) during slow-moving Tropical Depression Claudette on July 25-26, 1979. During 2016, the catastrophic “no-name” upper low that drifted across southern Louisiana dumped 31.39” in Watson, Louisiana. Harvey is arriving as a much stronger hurricane than these systems, so prolonged gale-force winds—perhaps extending well inland—have the potential to knock down many trees and power lines in areas where the soil is saturated, so power outages may be unusually extensive. Residents across south central and southeast Texas and southwest Louisiana should be prepared for the possibility of going multiple days without power.
 |
| Figure 5. Precipitation outlook from NOAA/NWS for the period from Friday evening, August 25, to Wednesday evening, August 30, 2017. If Harvey remains stalled in Texas beyond Wednesday, additional rain can be expected. Image credit: NOAA/NWS/WPC and NHC. |
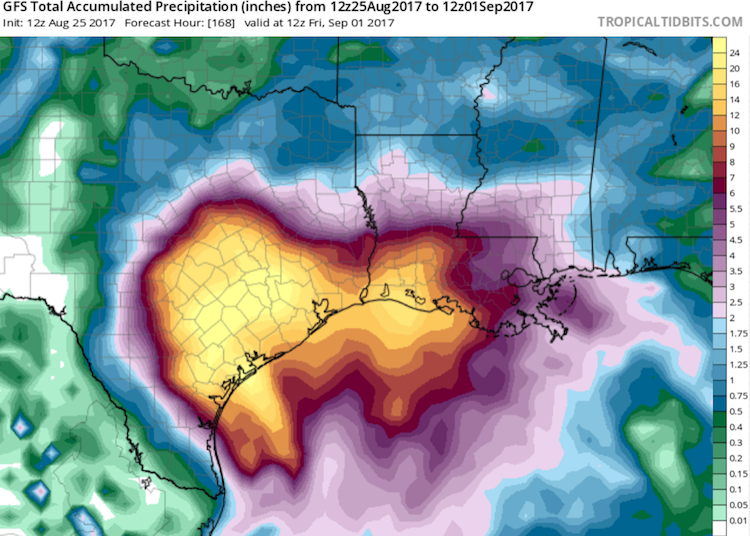
The latest 5-day precipitation outlook from the NOAA/NWS Weather Prediction Center (see Figure 5) projects that an area larger than the state of Massachusetts, including Houston and Galveston, can expect more than 20” of rain between now and Wednesday. Amounts of more than 10” cover an even larger area, extending into parts of the Austin-San Antonio urban corridor and including Corpus Christi and Beaumont-Port Arthur, TX, and Lake Charles, LA. Very serious flooding over the next several days can be expected well inland from the areas immediately at risk from Harvey’s initial landfall and storm surge. For example, Austin/San Antonio NWS office notes the potential for life-threatening flash flooding, especially from San Antonio south and east.
Official NHC storm surge guidance, which extends out to 72 hours (currently through Monday evening, August 28), is not intended to depict the longer-term threat—perhaps extending well beyond Monday—posed just inland by huge amounts of freshwater blocked by the surge from flowing to the sea. The multi-day onshore flow and storm surge coupled with extreme inland rainfall would push enormous amounts of water from several directions into Galveston Bay and the Houston Ship Channel. The result could be widespread, possibly unprecedented flooding early next week across southeastern parts of the Houston metropolitan area along and near the bay and the ship channel. See our post from Friday morning for more on this serious threat.
 |
| Figure 6. 7-day precipitation forecast from the 12Z Friday run of the GFS model, encompassing the period from 7:00 am CDT Friday, August 25, to 7:00 am Friday, September 1. The model predicts that localized totals in the brightest yellow area may be well above 20” (not shown). Image credit: tropicaltidbits.com. |
Should we believe the models?
Some of the rainfall forecasts from various model runs are even more mind-boggling than the official outlook. In many cases, the totals are “breaking the map”—producing local totals well beyond the highest-value colors on a particular model-derived map. It is important not to fixate on a particular model solution or a single forecast, because the contours of the heaviest rain could easily shift, and there may be a fairly sharp northwest edge to the most torrential sustained downpours. The outlook is also contingent on the notion (strongly supported by models) that Harvey will remain more or less stationary for several days. If Harvey somehow moves more quickly than expected, the risk of the heaviest rains will drop sharply.
I asked precipitation modeling expert Russ Schumacher (Colorado State University) to weigh in on how we should approach the seemingly outlandish high-end model output. He said: “Harvey is poised to maximize both rain rate and rain duration. Tropical cyclones are especially efficient at wringing moisture out of the atmosphere, and this storm is staying close to the moisture source (the warm waters of the Gulf of Mexico). Both of these factors are likely to contribute to very high rain rates. And then there’s the motion of Harvey, which looks like it might be almost stationary for multiple days, which will yield an especially long duration of rainfall over parts of the Texas Gulf Coast.
“We don’t really have a great sense for how well we should expect our models to perform in these scenarios, because they happen so rarely that we don’t have analogous cases to compare them against! Without more investigation, it’s hard to say for sure whether the global models and the more localized, convection-allowing models are representing the rainfall processes differently, but they’re delivering very much the same message: very high rain rates for an exceptionally long time. And although some of these extremely high point rainfall totals are remarkable, what’s probably going to be the bigger issue is the volume of water that will fall, with 10+ inches of rain over a large region, regardless of where the local maxima end up happening."
The take-home message is that large swaths of southern and eastern Texas could see devastating and potentially catastrophic flooding, perhaps developing or extending well into next week. Residents should prepare as if they may experience some of the highest water levels on record for their area.
 |
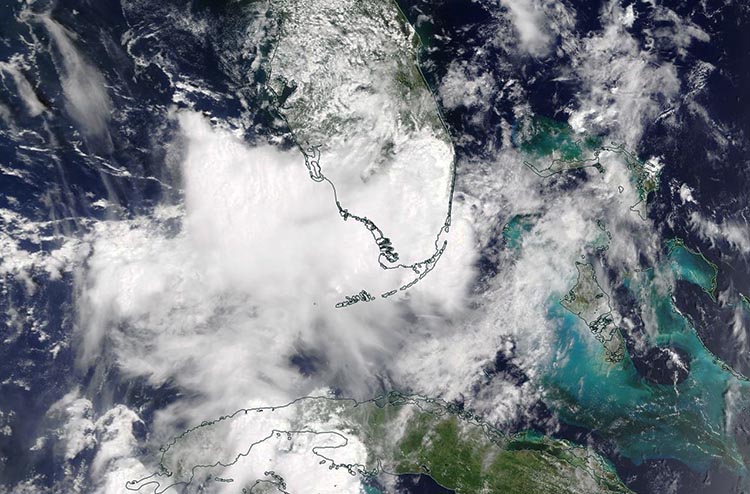
| Figure 7. Invest 92L along the southwest coast of Florida, as seen on Friday morning, August 25, 2017, by NASA’s Terra satellite. Image credit: NASA. |
92L disorganized near Florida, but may develop next week
Tropical disturbance 92L was located along the southwest coast of Florida on Friday afternoon. Satellite images showed that 92L had little heavy thunderstorm activity and very little organization, and high wind shear of 20 – 30 knots was hindering development. The system is expected to move to the northeast over Florida this weekend, spreading heavy rains of 3 – 5”, and may have better chances of development early next week, when it will begin accelerating to the northeast, parallel to the U.S. East Coast. The best chances for development may come on Tuesday, when wind shear is expected to drop to the moderate range, according to the 18Z Friday run of the SHIPS model. At that time, 92L is expected to be several hundred miles east of the coast of North Carolina. In its tropical weather outlook issued at 2 pm EDT Friday, the National Hurricane Center gave 92L 2-day and 5-day odds of development of 30% and 50%, respectively.
Jeff Masters co-wrote this post.


