Above: A couple walks on Marginal Street in Boston, Tuesday, March 13, 2018, amid snowfall from Winter Storm Skylar. Image credit: AP Photo/Michael Dwyer. |
A sprawling winter storm—the third in a punishing two-week series—dumped prodigious amounts of snow across much of New England on Tuesday. Blizzard warnings were hoisted for areas along and near a stretch of Atlantic coastline from southeast Massachusetts to the eastern tip of Maine, including the Boston and Portland metro areas. Snowfall totals of one to two feet were widespread over a broad swath of eastern New England, with amounts topping 2 feet beneath the heaviest snow bands. See updated snow totals below.
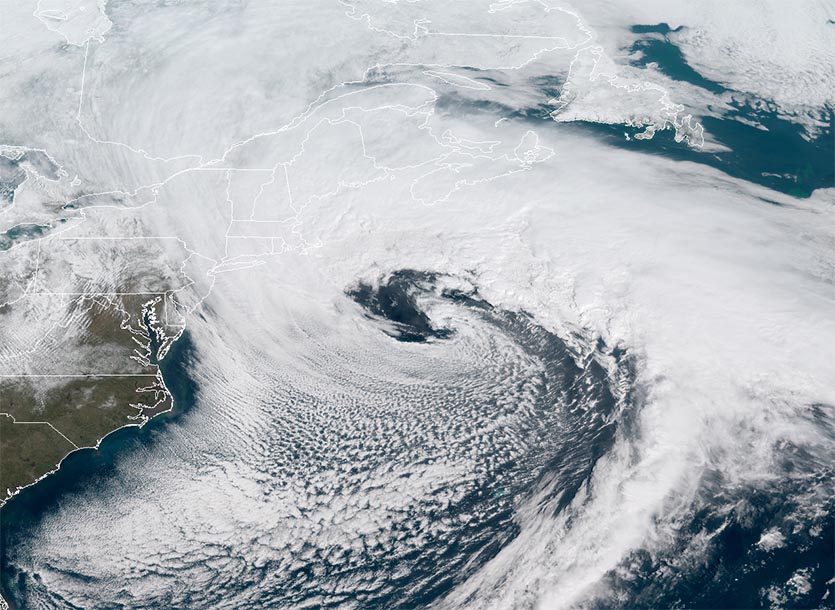
The storm’s surface low, positioned well offshore, qualified as a meteorological bomb or “bomb cyclone,” as its surface pressure dropped more than 24 millibars in the 24 hours leading up to Tuesday morning; the central pressure was 972 mb at 12Z (8am EDT) Tuesday morning. The low-level circulation of the storm, dubbed Skylar by The Weather Channel, was pumping fierce winds across New England. By 11 am EST Tuesday, blizzard conditions had already been confirmed at Hyannis, Falmouth, and Plymouth, MA. (The NWS definition of a blizzard is “sustained winds or frequent gusts of at least 35 mph and considerable falling and/or blowing snow frequently reducing visibility below ¼ mile for at least three hours.) As of 10 pm EDT Tuesday, Skylar had brought wind gusts as high as 81 mph to East Falmouth, MA; 79 mph at the Hyannis airport; and 77 mph on Nantucket Island, where 99% of customers were without power on Monday night.
 |
| Figure 1. GOES-16 satellite image of Winter Storm Skylar, taken at 11:00 am EDT Tuesday, March 13, 2018. The huge storm covered most of the Northwestern Atlantic, and was bringing heavy snow and near-hurricane-force wind gusts to Eastern Massachusetts. Image credit: NOAA. |
Conditions improved late Tuesday from south to north, but snow may persist over parts of northern New England and upstate New York well into Wednesday. See weather.com for frequent updates on Skylar as the day progresses, including detailed impacts and snowfall totals. NOAA’s storm summary for the nor’easter included these peak snowfall amounts, by state, through 4 am EDT Wednesday:
- New Hampshire: 27" at Northwood and Raymond; 26.5" at Atkinson
- Maine: 24" at Sanford; 21" near Shady Nook
- Massachusetts: 29.5" at Wilmington; 27.8" at Uxbridge
- Rhode Island: 25.1" at North Foster; 22.0" at Scituate
- Connecticut: 20.1" at East Killingly; 18.0" at Eastford
- Vermont: 19.7" near East Barre; 18.5" at Halifax
- New York: 18.3" at Southampton; 11" at Dix Hills and Plainview
- West Virginia: 18" in Calvin; 16" at Muddlety
- Virginia: 11.8" near Mustoe
- New Jersey: 7.5" at Highland Lakes
- North Carolina: 7" near Baldwin and in Todd
- Pennsylvania: 5" near Tunkhannock; 4.5" near Pocono Country and Sterling
- Ohio: 2.8" at Chardon
 |
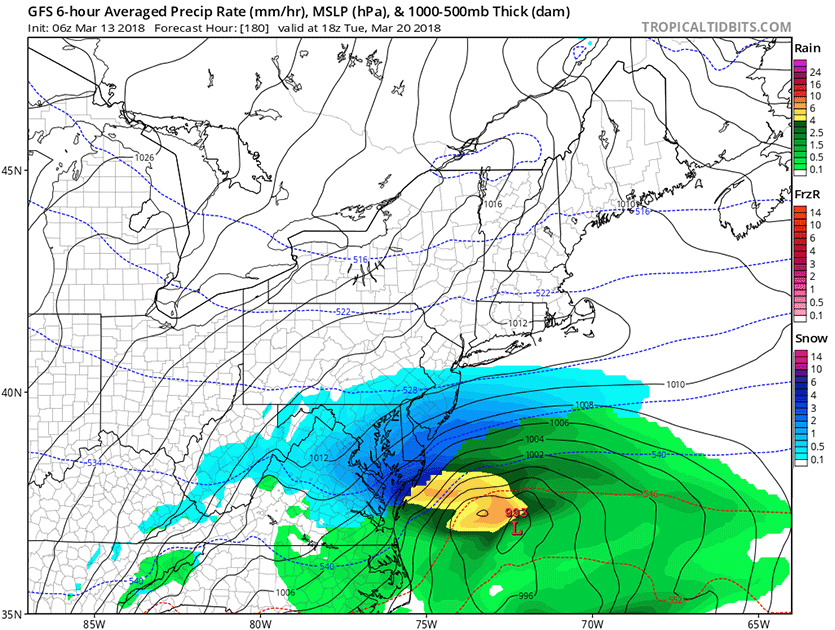
| Figure 2. Predicted precipitation (colors) and lines of constant pressure (black lines) valid at 2 pm EDT (18Z) Tuesday, March 20, 2018, from the 2 am EDT (6Z) Tuesday, March 13 run of the GFS model. A coastal storm is predicted to bring heavy rain and snow, plus strong winds, to the Mid-Atlantic coast. Image credit: Levi Cowan, tropicaltidbits.com. |
Yet another Northeast U.S. coastal storm possible next week
Our top weather forecasting models--the GFS and European models--have been predicting in recent runs that yet another coastal storm will impact the Northeast and Mid-Atlantic U.S. next week, in the Tuesday – Thursday timeframe. While the latest runs of these models did not show a “bomb” cyclone with major impacts to the coast next week, it is too early to be confident of this. Next week’s storm has the potential to be a nor’easter that will bring heavy rain and snow and strong winds. And with astronomical tides expected to be about 1.5’ higher next week than this week due to the phase of the moon, the potential for a damaging storm surge is higher.
If next week’s storm does indeed develop into a nor’easter, it would be the fifth significant nor’easter for the Northeast U.S. this year—and that’s a lot of big storms for one winter! Why so many nor’easters this year? Well, sometimes the atmosphere settles into a pattern that can last for several weeks, which features strong ridges and troughs and recurring storm systems. There's a very recent precedent for multiple snowstorms in the Boston area in a short period: February 2015. That month, the city got a record total of 64.8" of snow, including:
16.2" on Feb 2
22.2" on Feb. 8-9
16.2" on Feb. 14-15
If we shift to a smaller domain (750km away from the benchmark), this number decreases to an average of 2.3 bombogenesis events per cold season. 2009-10 had the most events by a large margin. pic.twitter.com/dQYOIe2lBe
— Tomer Burg (@burgwx) March 13, 2018
In the case of the winter of 2018, our active storm pattern was likely influenced by a record-strong phase of the Madden-Julian Oscillation in the tropical Pacific in January, which in turn fed into a split of the stratospheric polar vortex in February. The atmospheric reverberations of the split are still being felt, e.g., in unusually cold temperatures across much of Europe and Asia.
 |
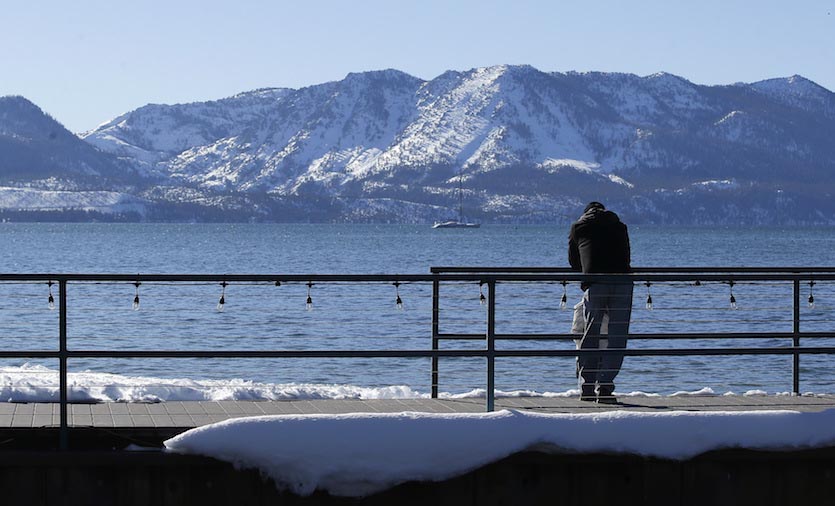
| Figure 3. Snow covers mountaintops overlooking Lake Tahoe on Monday, March 5, 2018, in South Lake Tahoe, Calif. A welcome late-winter storm at the beginning of March still left the state with less than half the usual snow for this late point in the state's important rain and snow season. Image credit: AP Photo/Rich Pedroncelli. |
Big snow out west: A much-needed wintry pattern for California
At the other end of the United States, an upcoming series of winter storms will be more than welcome. California’s Sierra Nevada—which supplies more than 60% of the state’s developed water supply—has racked up far less than its usual quotient of precipitation for the wet season that began on Oct. 1. The amount of water held in Sierra snowpack was running at just 36% of the normal value for the date as of Tuesday, March 13. Moisture has been even skimpier in Southern California. Downtown Los Angeles racked up only 3.01” of rain from October 1 to March 12, its fourth driest such period in records going all the way back to 1878.
The Sierra’s water supply will get a big boost from an imminent sequence of winter storms. One burst of snow will arrive Tuesday into Wednesday, and another should extend from Thursday into Saturday. The Tuesday-Wednesday storm alone could produce 12” or more of snow above 4000 feet, with up to three feet possible in favored spots. Even bigger totals are possible in the late-week storm. Another strong upper-level low will take up residence west of the California coast early next week; it’s too soon to know whether that one will end up plowing into the coast or lingering offshore.
During the tail end of a dry winter, California water watchers hope for a “March Miracle”—where late-season moisture salvages an otherwise dismal season. The classic March Miracle came in 1991, when a series of storms beginning on March 1 dropped half of a year’s worth of snowfall on the Sierra, including some 240 inches at the Sugar Bowl ski resort. Lake Tahoe’s snowpack went from 17% of the season-to-date average to 73% of average by the end of the month. This year, “despite the new storms in the forecast, there still aren’t signs of a repeat of that magnitude,” said Daniel Swain in a Monday post at California Weather Blog. More likely, he said, this month will produce some “March mitigation” rather than a 1991-style miracle. “At a minimum, it does appear that the Sierra Nevada will end March with a semi-respectable snowpack–even if it remains well below the historical average.”
Mandatory evacuation orders were once again in place on Tuesday in parts of Santa Barbara County, as the incoming storm could produce flash flooding near hillsides scorched by the fires of December 2017. A flash flood watch was in effect Tuesday for the Thomas, Wittier, Sherpa, and Alamo burn areas.
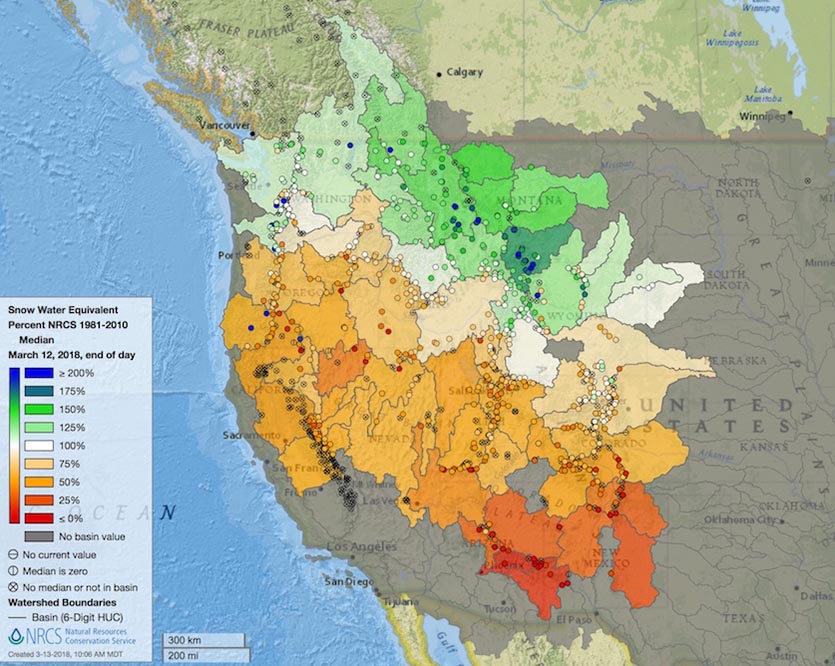
Beyond California, snowpack for the winter is well below average throughout most of the U.S. West roughly south of a line from Portland, Oregon, to Casper, Wyoming (see Figure 4 below). The shortfalls are most severe in the southern Rockies, home of the critical Upper Colorado River watershed that feeds into Lake Powell and Lake Mead.
 |
| Figure 4. Snow water equivalent (the amount of moisture held in snowpack) as of Monday, March 12, 2018, as derived from 980 stations across the U.S. and Canadian West. The values shown are percentages of the median winter snowpack recorded on this date during the climatological period 1981-2010. Image credit: USDA/NRCS and National Water and Climate Center. |
Snowpack in the Upper Colorado River Basin is now at the same level it was in 2002, the driest year on record for the southwest. pic.twitter.com/2Zex7ZcJ2p
— Luke Runyon (@LukeRunyon) March 8, 2018
Bob Henson co-wrote this post.


