| Above: The truck seen in this destroyed building was lofted in the aftermath of Hurricane Harvey’s rampage onto the Texas coast on August 25, 2017. The damage was likely caused by an intense tornado-scale vortex. A 3-second wind gust of 134 mph was measured by an anemometer at a height of 26 feet at a Doppler on Wheels mobile radar unit located about 1000 feet from this building. Harvey was classified as a Category 4 storm when it made landfall, with estimated top sustained winds of 135 mph. Image credit: Center for Severe Weather Research, via National Science Foundation. |
Hurricanes struck coastline after coastline during the hyperactive Atlantic hurricane season of 2017. In all, there were an incredible 22 tropical cyclone landfalls, plus a borderline landfall in Ireland. If nothing else, this onslaught provided plenty of raw material for evaluating wind speeds at hurricane landfall. As it turns out, land-based observations seldom live up to a hurricane’s Saffir-Simpson ranking at landfall. There are some very good reasons for the mismatch, as well as some potential implications for stakeholders, from insurance companies to the public at large. (Note: This is the first installment of a two-part post. Part II was published on Thursday, April 12.)
After its deadly rampage across the Caribbean, Hurricane Irma made two U.S. landfalls on September 10, 2017, as detailed in the post-storm report on Hurricane Irma released in March by the National Hurricane Center (NHC). Note that sustained surface winds refer to a 1-minute average, whereas a gust is typically defined as a 3-second average.
Landfall #1: near Cudjoe Key, Florida, around 9 am EST on 9/10/17
Strength: Category 4
Estimated sustained winds: 115 kt (130 mph)
Estimated central pressure: 931 mb
Landfall #2: near Marco Island, Florida, at 3:35 pm EST on 9/10/17
Strength: Category 3
Estimated sustained winds: 100 kt (115 mph)
Estimated central pressure: 936 mb
 |
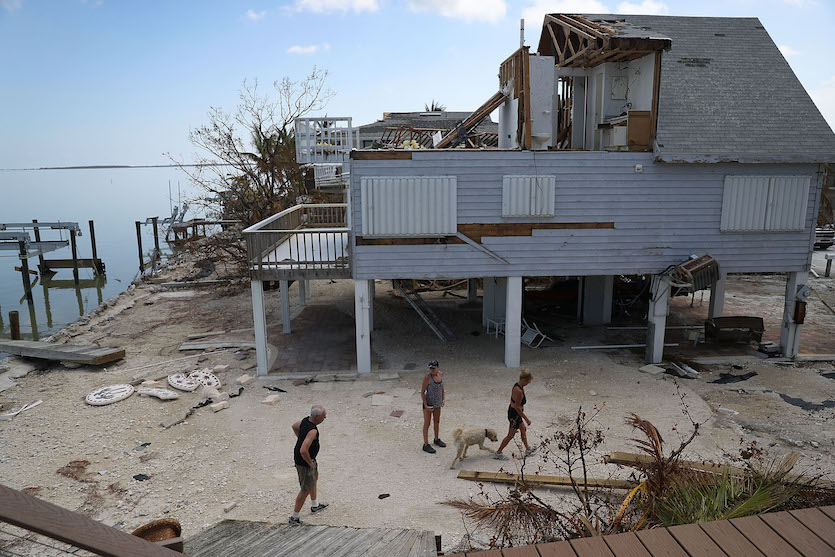
| Figure 1. Hurricane Irma produced major structural damage in Summerland Key, Florida, as pictured here on September 17, 2017. The Federal Emergency Management Agency estimated that 25 percent of all homes in the Florida Keys were destroyed and 65 percent sustained major damage from Irma. Image credit: Photo by Joe Raedle/Getty Images. |
There were no land-based measurements from isolated Cudjoe Key, and across the body of Florida, the NHC report lists only two measurements of sustained winds above Category 1 strength:
—a spotter report from Marco Island of sustained winds of 97 knots (111 mph) near the surface
—a tower-based U.S. Air Force report from Cape Canaveral of sustained winds of 90 knots (104 mph) at 459 feet
Because of frictional effects, we would expect the tower-based wind to be significantly weaker if measured at a height of 10 meters (33 feet), as recommended by the World Meteorological Organization.
The Saffir-Simpson rating of a landfalling hurricane is based on the most recent observations gathered from aircraft and satellite as the storm bears down on a coast. Scientists have long known that the winds of a hurricane spin down rapidly after landfall, and it’s unlikely that functioning weather stations will happen be located right where the peak wind occurs. We’ll explore these and other factors on Thursday in Part II of this post. Here, we delve into some of the challenges of actually measuring hurricane winds over land.
 |
| Figure 2. Map of selected observed sustained maximum wind speeds (in knots; multiply by 1.15 for miles per hour) during Hurricane Irma when it passed over Cuba and the southeastern United States. Image credit: NHC. |
The view from a mobile radar
Joshua Wurman (Center for Severe Weather Research, CSWR) led the development of the groundbreaking Doppler on Wheels platform in the 1990s. His team has carted DOW units to the Gulf and Atlantic coasts to document hurricane landfalls for more than 20 years. “Our anecdotal rule is that the peak gust observed will be equal—maybe—to what NHC says the peak sustained wind is. Sometimes it’s not even that strong,” Wurman told me.
When it comes to the wind threat, one of the biggest fears of forecasters is a hurricane that’s rapidly intensifying at landfall. Such was the case with Hurricane Harvey, the first major hurricane to make a U.S. landfall in almost 12 years (quickly followed by Irma in Florida and by Maria in Puerto Rico, which we’ll cover in Part II of this post).
Harvey spiked from Category 1 to 4 in the space of 24 hours and reached the Texas coast just east of Rockport only 3 hours later, around 9 pm EDT on August 25, with NHC-estimated sustained winds of 115 knots (135 mph), corresponding to the low end of the Category 4 range. (See the NHC's report on Harvey.)
The DOW group collected groundbreaking data from Harvey, including the first mapping and tracing of persistent tornado-scale vortices, as reported by Wurman and CSWR colleague Karen Kosiba in Monthly Weather Review last month. The top sustained wind measured by an anemometer atop the DOW unit was 46 meters per second (about 103 mph), with 3-second gusts of 134 mph, corresponding to a strong Category 2. An aerial survey also showed that a few structures might have experienced gusts in the 123-134 mph range.
“Some of our anemometers are on seawalls, levees—open-water locations where you’d think we would observe winds as high as they could get,” said Wurman.
 |
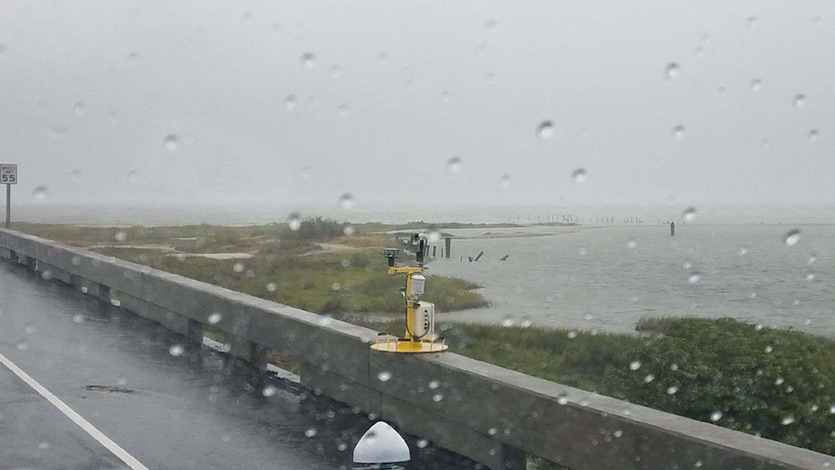
| Figure 3. This weather-station pod was deployed by the Center for Severe Weather Research on an elevated bridge along Texas State Highway 35 between Copano Village and Lamar. The eye of Hurricane Harvey passed over this location on August 25, 2017. Image credit: Center for Severe Weather Research, via National Science Foundation. |
Wurman’s sense is that few if any people—even right on the coast—will experience sustained winds on par with the NHC ratings for a landfalling hurricane. “Even if the open ocean values are correct, they are extremely non-representative,” he added. Wurman uses this rough analog: if a midlatitude winter storm producing 120-mph winds atop Mount Washington were heading toward Boston, the local forecast probably won’t leave Bostonians thinking they might experience the same wind. “NHC should make clear what scientists and engineers know is true—that max gusts over land will be near or below their open-ocean sustained-wind estimates.”
The case of Nate
Along with mobile radar, mesoscale networks (state-scale collections of weather stations) have become an increasingly vital tool for filling the gaps in measuring accurate surface data for landfalling hurricanes. At the University of South Alabama, Earth Sciences department chair and meteorology professor Sytske Kimball led the development in 2004 of the 25-station South Alabama Mesonet. Each of the stations includes 10-meter-high anemometers, which can be tough to properly deploy in a forested landscape.
“Finding an open location and a willing host can be next to impossible, especially in our area where trees and buildings are everywhere,” said Kimball.
 |
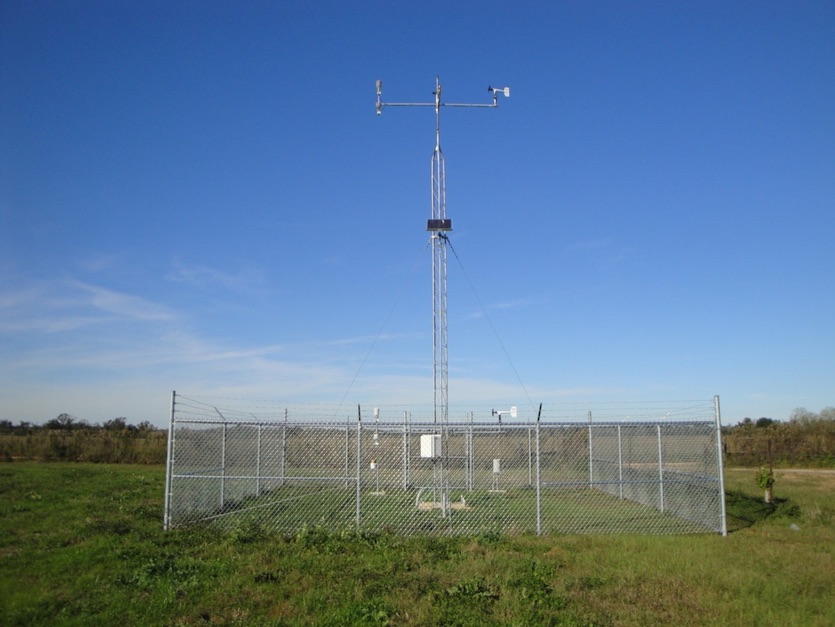
| Figure 4. One of the research-grade automated weather stations that make up the 25-station South Alabama Mesonet. Image credit: South Alabama Mesonet. |
The South Alabama Mesonet was well positioned to sample Hurricane Nate, a messy, asymmetric system that made landfalls near the mouth of the Mississippi River around 7 pm CDT on October 7 and near Mobile, AL, at 12:30 pm CDT on October 8, 2017. At the time of each landfall, Nate was classified as a Category 1 storm with 85-mph sustained winds, based in part on a Hurricane Hunter flight-level wind measurement of 89 knots (102 mph) from around a mile above sea level, together with near-surface SFMR estimates of around 70 knots (80 mph).
On the ground, there were no land-based reports from Nate of sustained winds of hurricane force (65 knots or 74 mph). Even the gusts fell short: the strongest onshore was a mere 57 knots (66 mph) at Mobile Regional Airport, according to NHC’s report on Nate issued last week. The highest gust from the South Alabama Mesonet was 54 mph at Grand Bay.
Addison Alford, a doctoral student at the University of Oklahoma (OU), is employing mobile radar data from hurricane landfalls—including observations from OU’s Shared Mobile Atmospheric and Teaching Radar (SMART-R), which he helped deploy in Harvey—as part of his dissertation. “We all like to think of hurricanes as nice, axisymmetric features, but in reality that is not the case,” said Alford. “For Nate specifically, I expect the observation of less than hurricane-force winds at landfall had a lot to do with its asymmetric structure and a sparse observing system. Unless you have stations very close to the coast, it may be difficult to observe hurricane-force winds in a Category 1 storm, given the rapid change in the boundary layer structure [the lowest kilometer of the atmosphere] during landfall.”
 |
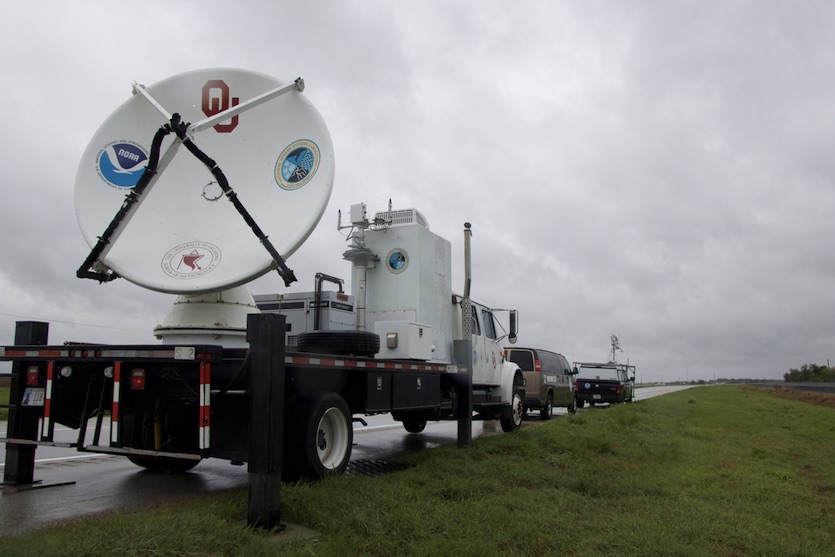
| Figure 5. The University of Oklahoma’s Shared Mobile Atmospheric Research and Teaching Radar (SMART-R) radar sampled Harvey and Irma during the 2017 hurricane season. Image credit: OU School of Meteorology. |
Gleaning data from a network of networks
The South Alabama Mesonet is part of the National Mesonet, an effort launched in 2009 to stitch the nation’s variegated set of mesoscale networks into a coherent whole. The project now includes 35,000 stations and platforms from some 45 partners, including state-operated mesonets and a number of private-sector networks.
“Obviously, they are all not the same, and it isn't a uniform nationwide network,” said Curtis Marshall, who heads up the program for NOAA. “But to be part of the ‘network,’ they all have to ascribe to minimum standards for data quality, provision of metadata, and the like.” The program saves NOAA and taxpayers money by mandating standards and coordinating the flow of data rather than building and maintaining instruments.
One of the National Mesonet participants is WeatherFlow, a private firm that collects and analyzes data from more than 400 of its own hurricane-hardened wind sensors. Among WeatherFlow’s clients are insurers trying to connect the dots between hurricane damage and observed winds. Based on data from his company’s instruments and others, WeatherFlow’s Marty Bell sees frictional effects as the main culprit in quickly reducing winds just after landfall.
“As soon as storm winds come ashore, trees, buildings and other land covers impose a big increase in the frictional drag, which rapidly slows the surface winds. If we account for that slowdown, the numbers are generally within the NHC's stated range of uncertainty,” Bell told me. He’ll be addressing the topic at next week’s 33rd AMS Conference on Hurricanes and Tropical Meteorology. The talk abstract includes this observation: “When the over-water storm estimate and inland observing environments are reconciled, we find that the differences are not as great as they initially appear. This has important ramifications [for] public safety, the insurance industry and others since there is a widely-held belief that the NHC often over-estimates storm intensity by a category or more.”
We’ll have more in Part II of our post on Thursday.


