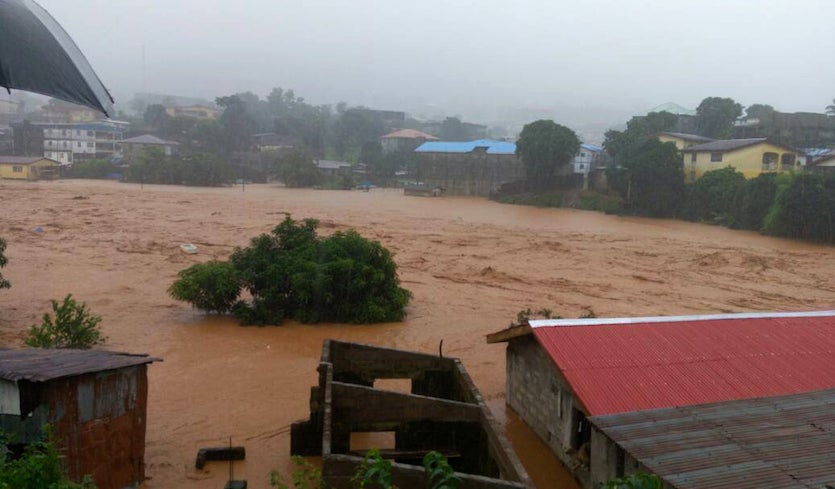
| Above: The deadliest weather-related disaster of August was a series of landslides and flash floods that struck Freetown, the capital of Sierra Leone, in the early hours of August 14, killing approximately 1,050 people. The hardest hit area was Regent, located to the south of the city center, where a portion of Mount Sugar Loaf collapsed. About 1,100 homes were damaged or destroyed, and 4,000 people were left homeless. In this image, we see mud and water flow through Freetown, Sierra Leone, on Monday, Aug. 14, 2017, following torrential rains in the area. Image credit: Society 4 Climate Change Communication, via AP. |
August 2017 was the planet's third warmest August since record keeping began in 1880, said NOAA's National Centers for Environmental Information (NCEI) on Monday. NASA rated August 2017 as the second warmest August on record. The only warmer Augusts, according to NOAA, came during 2016 and 2015, when a strong El Niño was helping increase global temperatures. Minor differences can occur between the NASA and NOAA rankings because of their different techniques for analyzing data-sparse regions such as the Arctic.
Global ocean temperatures last month were the fourth warmest on record for any August, according to NOAA, and global land temperatures were the second warmest on record. Global satellite-measured temperatures for the lowest 8 km of the atmosphere were the third or second warmest for any August in the 39-year record, according to the University of Alabama Huntsville (UAH) and Remote Sensing Systems (RSS), respectively.
 |
| Figure 1. Departure of temperature from average for August 2017, the third warmest August for the globe since record keeping began in 1880. Record warmth was observed in northern South America, the Middle East, and southern and southeastern Asia. No land or ocean areas experienced record cold August temperatures. Image credit: National Centers for Environmental Information (NCEI). |
Second-warmest year on record thus far
Each of the first eight months of 2017 have ranked among the top three warmest such months on record, giving 2017 the second highest January–August temperature in the 138-year record: 0.88°C (1.58°F) above the 20th century average. This is behind the record year of 2016 by 0.13°C (0.24°F). This near-record warmth is especially remarkable given the lack of an El Niño event this year. Global temperatures tend to be warmer during El Niño years, when the ocean releases more heat to the atmosphere. Given the lack of an El Niño event in 2017, it is unlikely that we will surpass 2016 as the warmest year on record. However, 2017 is almost certain to be the planet's warmest year on record that lacks any influence from El Niño, and Earth's four warmest years of the last century-plus are likely to be 2016, 2017, 2015, and 2014.
Three billion-dollar weather disasters in August 2017
Three billion-dollar weather disasters hit the Earth last month, according to the August 2017 Catastrophe Report from insurance broker Aon Benfield: a $2.5 billion drought in China, the $3.5 billion from Typhoon Hato in Macau, Hong Kong, and China, and the tens of billions in damage done by Hurricane Harvey in Texas and Louisiana. Through the end of August, Earth had nineteen billion-dollar weather events for the year, which is a typical number for this point in the year. The year that ended with the most billion-dollar weather disasters in records going back to 1990 was 2013, with 41; that year had 28 billion-dollar disasters by the end of August. Last year, there were 27 billion-dollar weather disasters by the end of August; that year ended up with 31 such disasters. Here are this year’s billion-dollar weather disasters through the end of August:
Hurricane Harvey, U.S., 8/25 – 9/2, >$20 billion, 60 killed
Flooding, China, 6/22 – 7/5, $7.5 billion, 141 killed
Flooding, China, 7/13 – 7/17, $4.5 billion, 20 killed
Typhoon Hato, Macau, Hong Kong, China, 8/23 – 8/24, $3.5 billion, 22 killed
Flooding, Peru, 1/1 – 4/1, $3.1 billion, 120 killed
Severe Weather, Rockies, Plains, U.S., 5/8 – 5/11, $2.6 billion, 0 killed
Drought, China, 5/1 – 8/31, $2.5 billion, 0 killed
Tropical Cyclone Debbie, Australia, 3/27 – 4/5, $2.4 billion, 14 killed
Drought, Italy, 1/1 – 7/31, $2.3 billion, 0 killed
Severe Weather, Plains, Southeast, Midwest U.S., 3/26 – 3/28, $2.3 billion, 0 killed
Severe Weather, Midwest, Plains, Southeast U.S., 3/6 – 3/10, $2.1 billion, 0 killed
Severe Weather, Midwest, Plains, Southeast MS Valley U.S., 4/28 – 5/01, $2.0 billion, 20 killed
Drought, Somalia, Ethiopia, Kenya, 1/1 – 3/31, $1.9 billion, hundreds killed
Severe Weather, South U.S., 2/27 - 3/2, $1.9 billion, 4 killed
Severe Weather, Midwest U.S., 6/11, $1.8 billion, 0 killed
Severe Weather, South U.S., 1/18 - 1/23, $1.3 billion, 21 killed
Tropical Storm Nanmadol, Japan, 7/4 – 7/6, $1.0 billion, 37 killed
Severe Weather, Plains, Midwest, Northeast U.S., 6/27 – 6/30, $1.0 billion, 0 killed
Winter Weather, Plains, Midwest, Southeast, Northeast U.S., 3/13 – 3/15, $1.0 billion, 11 killed
 |
| Billion-Dollar Disaster 1. Hurricane Harvey hit Texas as a Category 4 hurricane with 130 mph winds on August 25, then stalled over Houston for three days, dumping up to 51.88” of rain. The storm then drifted out to sea, and made another landfall near Beaumont, Texas, dumping catastrophic rains of more than 25 inches in 24 hours. Harvey caused tens of billions in damage, and was being blamed for at least 60 deaths. Above: People walk down a flooded street as they evacuate their homes after the area was inundated with flooding from Hurricane Harvey on August 28, 2017 in Houston, Texas. Image credit: Joe Raedle/Getty Images. |
 |
| Billion-Dollar Disaster 2. Typhoon Hato hit Macau, Hong Kong, and Mainland China on August 23 as a Category 3 storm. The typhoon did $3.5 billion in damage and killed 22 people. In this image, we see a flooded playground in Hong Kong after Typhoon Hato hit on August 23, 2017. Image credit: ANTHONY WALLACE/AFP/Getty Images. |
 |
| Billion-Dollar Disaster 3. Drought conditions in China during the summer of 2017 have cost at least $2.5 billion in damages. Above: This photo taken on July 24, 2017 shows boats sitting in the dried-up bottom of the Mihe river in Weifang in China's eastern Shandong province. Once used for leisure activities, the river has dried up due to drought over the past few years and is now used by locals for grazing horses, sheep and cattle. Image credit: STR/AFP/Getty Images. |
55 – 60% chance of La Niña by winter
In its September 14 monthly advisory, NOAA’s Climate Prediction Center (CPC) stated that neither El Niño nor La Niña conditions were present in the Eastern Pacific (ENSO-neutral conditions existed). Sea surface temperatures (SSTs) in the benchmark Niño 3.4 region (in the equatorial Pacific) were about 0.7°C below average over the past week; SSTs of 0.5°C or more below average in this region are required to be classified as weak La Niña conditions, with the 3-month average SSTs holding at these levels for five consecutive months (with an accompanying La Niña-like atmospheric response). A surge of enhanced east-to-west blowing trade winds is predicted for the west-central Pacific over the next two weeks, and these stronger-than-average trade winds will help the progression towards La Niña. NOAA forecasters gave a 55 - 60% chance of an La Niña event by winter—a major upgrade from their previous month’s forecast.
Figure 2. Sea surface temperatures (SSTs) in the benchmark Niño 3.4 region (in the equatorial Pacific) were hovering at about 0.7°C below average for the first half of September, below the 0.5°C below average threshold for weak La Niña conditions. Image credit: Levi Cowan, tropicaltidbits.com.
Arctic sea ice extent the third lowest on record for August
Arctic sea ice extent during August 2017 was the third lowest in the 38-year satellite record, according to the National Snow and Ice Data Center (NSIDC). The Arctic was dominated by a broad area of low pressure, which brought cloudy skies and slower ice loss than we saw in the record-low extent years of 2012 and 2007. The Arctic is currently close to its lowest extent for the year, and it appears this seasonal low will be the 6th - 8th lowest on record, behind the lows recorded in 2012, 2007, 2016, 2011, and 2015.
Antarctic sea ice extent the lowest on record for August
Sea ice surrounding Antarctica has been at unprecedented lows in recent months, setting an all-time monthly minimum extent record each month during the five-month period November 2016 – March 2017, and again in August of 2017. Monthly Antarctic sea ice extent in April, May, June, and again in August of 2017 were the second lowest on record for their respective months. A recent study by John Turner and colleagues links the recent Antarctic sea ice decline to a series of strong storms accompanied by long periods of warm winds from the north. These changing weather conditions are associated with large shifts in the Southern Annual Mode (SAM) index.
Notable global heat and cold marks set for August 2017
Hottest temperature in the Northern Hemisphere: 52.8°C (127.0°F) at Death Valley, U.S., 1 August
Coldest temperature in the Northern Hemisphere: -32.9°C (-27.2°F) at Summit, Greenland, 27 August
Hottest temperature in the Southern Hemisphere: 40.7°C (99.3°F) at Xavantina, Brazil, 31 August
Coldest temperature in the Southern Hemisphere: -81.9°C (-115.4°F) at Dome Fuji, Antarctica, 26 August
(Courtesy of Maximiliano Herrera.)
Major weather stations that set (not tied) new all-time heat or cold records in August 2017
So far in 2017, 161 major weather stations have set records for the all-time highest temperature ever measured, and 17 have set records for the all-time lowest temperature ever measured. Here are the records for August 2017:
Alghero Fertilia (Italy) max. 41.9°C, 1 August
Perugia (Italy) max. 41.0°C, 2 August
Monte Argentario (Italy) max. 40.4°C, 2 August
Consuma Pass (Italy) max. 34.7°C, 2 August
Cottede (Italy) max. 37.1°C, 2 August
Serravalle (San Marino) max. 40.3°C, 3 August: New national record high for San Marino*
Split (Croatia) max. 42.3°C, 3 August
Zadar Puntamika (Croatia) max. 36.3°C, 4 August
Montclus (France) max. 42.9°C, 4 August
Nimes Airport (France) max. 39.9°C, 4 August
Montpellier Airort (France) max. 37.7°C, 4 August
Campobasso Monforte (Italy) max. 38.4°C, 4 August
Cape Frasca (Italy) max. 42.0°C, 4 August
Frontone (Italy) max. 39.8°C, 4 August
Mont Calamita (Italy) max 37.2°C, 4 August
Guidonia (Italy) max. 42.0°C, 4 August
Frosinone Airport (Italy) max. 42.8°C, 4 August
Arezzo (Italy) max. 42.1°C, 4 August
Parma (Italy) max. 40.5°C, 4 August
Bologna Obse. (Italy) max. 40.5°C, 4 August
Bologna Airport (Italy) max. 40.1°C, 4 August
Ferrara (Italy) max. 41.4°C, 4 August
Forli (Italy) max. 43.0°C, 4 August
Urbino (Italy) max. 39.4°C, 4 August
Volano (Italy) max. 40.5°C, 4 August
Trieste Airport (Italy) max. 38.0°C, 5 August
Triste Downtown (Italy) max. 37.5°C, 5 August
Siena (Italy) max. 40.0°C, 5 August
Maehara (Japan) max. 38.9°C, 5 August
Yamaguchi ken Shimomatsu (Japan) max. 36.4°C, 5 August
Ehime (Japan) max. 37.2°C, 5 August
Cannes (France) max. 38.3°C, 6 August
Kosghigawa (Japan) max. 37.6°C, 6 August
Ota (Japan) max. 38.4°C, 6 August
Hikawa (Japan) max. 37.8°C, 6 August
Kakeya (Japan) max. 36.9°C, 6 August
Hamada (Japan) max. 38.5°C, 6 August
Yayei (Japan) max. 35.0°C, 6 August
Masuda (Japan) max. 39.3°C, 6 August
Faruda (Japan) max. 38.4°C, 6 August
Hagi (Japan) max. 38.3°C, 6 August
Izumo (Japan) max. 38.4°C, 6 August
Itoigawa (Japan) max. 37.5°C, 7 August
Osmaniye (Turkey) max. 43.6°C, 8 August
Baku Airport (Azerbaijan) max. 41.1°C, 9 August
Shkoder (Albania) max. 42.8°C, 9 August
Makarska (Croatia) max. 39.7°C, 9 August
Sibenik (Croatia) max. 39.4°C, 10 August
Knin (Croatia) max. 42.3°C, 10 August
Danuvar (Croatia) max. 40.0°C, 10 August
Banja Luka (Sprska Republic, Bosnia and Herzegovina) max. 41.8°C, 10 August
Neum (Bosnia and Herzegovina) max. 41.2°C, 10 August
Kumejima (Japan) max. 35.3°C, 12 August
Wetland Park (Hong Kong, China) max. 39.0°C, 22 August: New territorial record high for Hong Kong
Ta Kwu Ling (Hong Kong, China) max. 38.5°C, 22 August
Hong Kong Observatory (Hong Kong, China) max. 36.6°C, 22 August
Taipa (Macau, China) max. 38.0°C, 22 August
* The record was also tied on 9 August.
Notes:
On 2 August, the most representative weather station near Vatican City, Roma Macao AWS, hit 40.7°C, tying the national record of Vatican City.
On 22 August, Ka Ho, Coloane Island in Macau recorded 39.0°C, which ties the territorial record high for Macau.
(Courtesy of Maximiliano Herrera.)
Four all-time national heat records set or tied in August 2017
All-time national heat records were set or tied in Macau, Hong Kong, San Marino, and Vatican City in August 2017. As of September 17, thirteen nations have set or tied all-time national heat records in 2017, and two have set or tied all-time cold records. National all-time monthly temperature records so far in 2017 have numbered 40 for maximum temperature, and 2 for minimum temperature. Most nations do not maintain official databases of extreme temperature records, so the national temperature records reported here are in many cases not official. I use as my source for international weather records researcher Maximiliano Herrera, one of the world's top climatologists, who maintains a comprehensive list of extreme temperature records for every nation in the world on his website. If you reproduce this list of extremes, please cite Maximiliano Herrera as the primary source of the weather records.
All-time national heat records set or tied in 2017:
Macau: 102.2°F (39.0°C) at Ka Ho, Coloane Island, 22 August (tie)
Hong Kong: 102.2°F (39.0°C) at Wetland Park, 22 August
San Marino: 104.5°F (40.3°C), at Serravalle, 3 and 9 August
Vatican City: 105.3°F (40.7°C) at Roma Macao AWS, 2 August (tie)
United Arab Emirates: 125.2°F (51.8°C), at Mezaira, 30 July
Spain: 117.1°F (47.3°C), at Montoro AEMET, 13 July
Iran: 128.7°F (53.7°C), at Ahwaz, 29 June
Oman: 123.4°F (50.8°C), at Qurayyat on 30 May and at Joba on 31 May (tie)
Pakistan: 128.3°F (53.5°C), at Turbat on 28 May (tie)
Guinea: 113°F (45.0°C), at Koundara, 29 March (tie)
Ghana: 110.8°F (43.8°C), at Navrongo, 26 March
Chile: 113°F (45.0°C), at Cauquenes, 26 January
Cocos Islands (Australia): 91.0°F (32.8°C), at Cocos Island Airport, 23 February (tie with 8 April 2015 and 11 April 1998)
All-time national cold records set in 2017:
United Arab Emirates: 22.3°F (-5.4°C) at Jabel Jais, 3 February
Qatar: 34.7°F (1.5°C) at Abu Samra, 5 February
National monthly maximum temperature records set in 2017 (41):
Jan: Comoros, Uganda, Singapore, Mexico
Feb: Iceland
Mar: Kenya, Indonesia, Spain, Chile, Cook Islands
Apr: Ghana, Wallis and Futuna, Honduras, Samoa, Uganda, Pakistan, Cape Verde, UAE
May: Greece, Iran, Norway, Austria
June: Mexico, Oman, Iraq, Turkey, Albania, Portugal
July: Cyprus, Comoros, Mayotte, Saudi Arabia, Indonesia, UAE, Niger
August: Iran, UAE, Trinidad and Tobago, USA
September: Syria, Saudi Arabia
National monthly minimum temperature records set in 2017 (2):
Jan: St Eustatius
July: Greenland
Other records set in 2017:
World record of highest minimum temperature for March: 35.6°C at Yelimane, Mali, 31 March
Asian record of highest temperature ever recorded in April: 50.0°C at Larkana, Pakistan, 19 April
World record of highest temperature ever recorded in May (tied): 53.5°C at Turbat, Pakistan, 28 May
Asian record of highest temperature ever recorded in June: 53.7°C at Ahwaz, Iran, 29 June
Northern Hemisphere record of lowest temperature ever recorded in July: -33.0°C at Summit, Greenland, 4 July
 |
Figure 2. Twenty stations in the world recorded more than ten days with a maximum temperature ≥ 50 °C in 2017 (top), and 17 stations had four or more nighttime minimum temperatures ≥ 36°C (96.8°F), (bottom). Image credit: Jérôme Reynaud , Géoclimat. |
Earth has had a record 700 exceedances of 50°C (122°F) in 2017
According to French climatologist Jérôme Reynaud, the temperature has reached or exceeded 50°C (122°F) more than 700 times in the world in 2017 (in 10 countries*). That’s an absolute record, surpassing the previous record of 300+ times, set in 2016. Twenty stations in the world have recorded more than ten days with a maximum temperature ≥ 50 °C in 2017. Mitribah (Kuwait) [46 days] is far ahead of Mehran (Iran) [29 days], Basrah-Hussen (Iraq) [26 days] and Furnace Creek (Death Valley, United States) [25 days].
Find the inventory of maximum temperatures ≥ 50 °C in the world in 2017 at: www.geoclimat.org/2017/05/temperatures-max-sup50-2017.html
Since the beginning of 2017, particularly high nighttime temperatures have also been observed in several regions of the world (in 10 countries**). There have been 200+ instances of nighttime minimum temperatures of at least 36°C (96.8°F) (including some at an elevation about 800 meters). Hoseyniyeh (Iran) leads [22 days], ahead of Furnace Creek (Death Valley, United States) [17 days], and Kuwait City (Kuwait) [14 days]. A new world record of nighttime heat was also observed in Oman: 44.2°C (111.6°F) on the night of 16 to 17 June, 2017, at Khasab Airport.
Find the inventory of minimum nighttime temperatures > 36°C in the world in 2017 at: www.geoclimat.org/2017/07/tmin-nocturnes-max-monde-2017.html
* China, Iran, Iraq, Kuwait, Mexico, Oman, Pakistan, Saudi Arabia, United Arab Emirates, United States.
** Algeria, China, Iran, Iraq, Kuwait, Oman, Qatar, Saudi Arabia, United Arab Emirates, United States.


