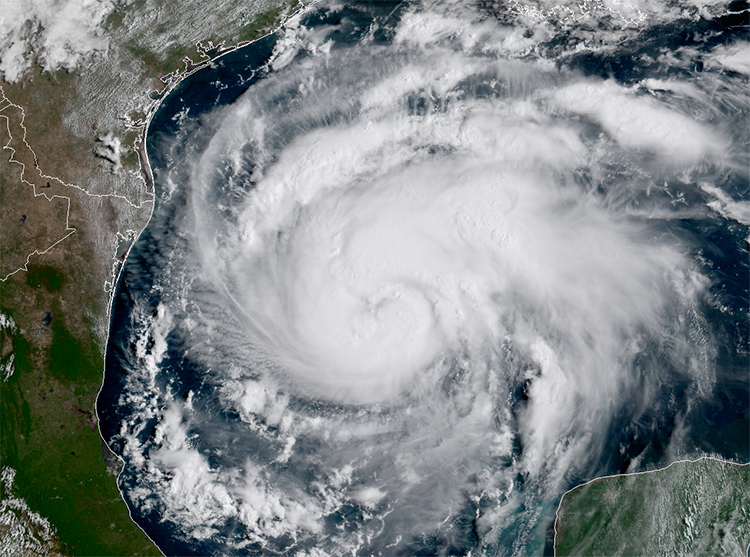
| Above: GOES-16 infrared satellite image of Harvey as of 1426Z (9:26 am CDT) Thursday, August 24, 2017. Image credit: NASA/MSFC Earth Science Branch. GOES-16 images are preliminary and non-operational. |
Hurricane Warnings and Storm Surge Warnings are up for portions of the coast of Texas as rapidly intensifying Tropical Storm Harvey heads north-northwest at 10 mph over the Gulf of Mexico. Harvey was still a tropical depression at 10 pm CDT Wednesday night, but has explosively intensified in the early morning hours, and is almost certain to be a hurricane later today. Update: The National Hurricane Center (NHC) has upgraded Harvey to a Category 1 hurricane with 80-mph sustained winds as of noon CDT Thursday. If you live on the coast of Texas, please heed the advice of local emergency management officials, and get out today if you live in an evacuation zone. Tropical storm-force winds may arrive along the coast of Texas as early as 8 am CDT Friday, making evacuation difficult thereafter, according to the latest National Hurricane Center (NHC) forecast.
 |
| Figure 1. Earliest reasonable arrival time of tropical storm-force winds for Harvey, from the 10 am CDT Thursday NHC advisory. |
Harvey rapidly strengthening
At 6:42 am CDT Thursday, an Air Force hurricane hunter plane found that Harvey had formed a partial eyewall, with a 986 mb pressure. By 8:04 am CDT, the eye had completely closed off, and the pressure had fallen another 2 mb, to 984 mb. By 10 am CDT, the pressure had fallen another 2 mb, to 982 mb. This is the central pressure that a Category 1 hurricane typically has, but the Hurricane Hunters measured top surface winds of just 65 mph. It takes up to six hours for a tropical cyclone's winds to respond to a fall in pressure, so I expect that Harvey will be a hurricane by the 4 pm CDT Thursday advisory.
Conditions in the Gulf of Mexico on Thursday morning were very favorable for intensification. Satellite images showed that Harvey was a large storm, whose high-level cirrus clouds were already spreading over extreme southern Texas. Harvey had an intense ring of heavy thunderstorms surrounding the eye, and solid low-level spiral bands were forming. The eye was just beginning to appear on both visible and infrared imagery at 10 am CDT. High cirrus clouds streaming away from the center showed the presence of upper-level outflow to the north and east, which was ventilating the storm and allowing intensification to occur. Wind shear was light, 5 – 10 knots, which is favorable for intensification. The atmosphere had a high mid-level relative humidity of 70%, and the ocean was very warm, with sea surface temperatures (SSTs) of 30.5°C (87°F.) This was about 2°F above average for this time of year. Warm waters extended deep into the ocean, providing a large reservoir of heat for the storm to draw upon. The outer bands of Harvey are visible on Brownsville long-range radar.
 |
| Figure 2. Microwave satellite image of Harvey at 8:27 am EDT Thursday, August 24, 2017. The eye was clearly evident as a blue spot with a semicircular partial eyewall (red colors) seen along the southern side of the eye. Image credit: Naval Research Lab, Monterey. |
Intensity forecast for Harvey
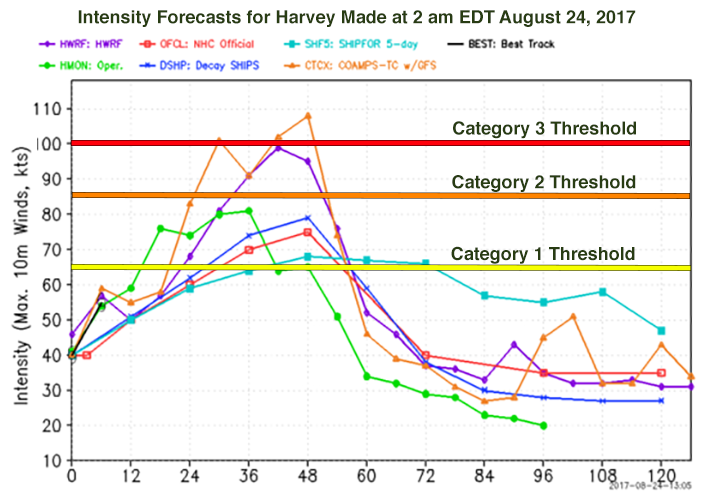
Now that Harvey has a well-formed structure, I don’t see any impediments to it intensifying right up until landfall. I expect Harvey will be a Category 2 hurricane by Friday morning and a Category 3 hurricane by Friday night. Harvey probably does not have enough time to become a Category 4 storm, though we cannot rule that possibility out yet.
The current favorable conditions for development will remain in place through Friday night, according to the 12Z Thursday run of the SHIPS model. Wind shear will remain light to moderate, and the atmosphere will be moist. SSTs will remain near 30°C (86°F), and warm waters will extend to considerable depth, with a total ocean heat content of 50 – 80 kilojoules per square centimeter. From Thursday night into Friday, Harvey will get an extra boost in energy as it passes over a warm-core eddy that broke off from the Loop Current. The oceanic heat content within the eddy exceeds 75 kilojoules per square centimeter, enough to support rapid intensification. However, the heat content of this eddy is not as high as the heat content available to Hurricane Katrina of 2005, when it moved over a similar warm-core eddy.
This morning’s runs of our top intensity models—the HWRF, LGEM, COAMPS-TC, and DSHIPS—all predicted a Category 2 or 3 hurricane at landfall.
 |
| Figure 3. Beginning early Friday, Harvey is predicted to pass over a warm-core eddy that broke off from the Loop Current near the Yucatan Channel earlier this year, then drifted to a position off of the Texas coast. The oceanic heat content within the eddy exceeds 75 kilojoules per square centimeter, enough to support rapid intensification. Image credit: RAMMB @ CSU/CIRA |
 |
| Figure 4. Intensity forecasts made for Harvey at 2 am EDT Thursday, August 24, 2017. Of these models, the most reliable predicted Harvey would be a Category 2 or 3 hurricane by landfall on Friday night on the coast of Texas. Image credit: Image credit: NOAA/NCEP/EMC. |
Comparison to historical major hurricanes to hit Texas
There are several historical cases of August hurricanes undergoing rapid intensification to Category 3 status just before landfall in Texas. Hurricane Alicia of 1983 took 36 hours to intensify from a tropical storm with 70 mph winds to a Category 3 hurricane with 115 mph winds. During that time, the pressure dropped from 998 mb to 963 mb. Alicia killed 21 people and caused $1.7 billion in damage (1983 dollars.) Hurricane Celia of 1970 took twelve hours to intensify from a Category 1 hurricane with 85 mph winds to a Category 3 hurricane with 125 mph winds just before landfall. Celia hit the coast very close to where Harvey is expected to, killing 27 and causing $930 million in damage (1970 dollars.)
 |
| Figure 5. Tracks of Hurricane Alicia (left) and Celia (right). |
Track Forecast for Harvey
The 0Z and 6Z Thursday operational runs of our five best models for predicting tropical cyclone tracks—the GFS, European, HWRF, UKMET, and HMON (which replaced the old GFDL model this year)—all predicted that Harvey would make landfall along the central Texas coast within about 100 miles of Corpus Christi on Friday evening or Saturday morning. However, the ridge of high pressure steering Harvey will weaken at that time, resulting in a collapse of the steering currents and a slow and erratic motion for the storm. As a result, Harvey is expected to remain stalled out over coastal Texas through the weekend, dumping torrential rains along the way. One particularly worrisome possibility is that the center of Harvey will re-emerge over the Gulf of Mexico early next week, allowing the storm to re-intensify and dump even more heavy rains along the coast.
Impacts
Wind: The 10 am CDT Wind Speed Probability Forecast from NHC calls for the greatest chances of hurricane-force winds in Port O’Connor and Rockport--about a 65% chance. Corpus Christi has a 45% chance, Galveston a 14% chance, and Brownsville an 11% chance.
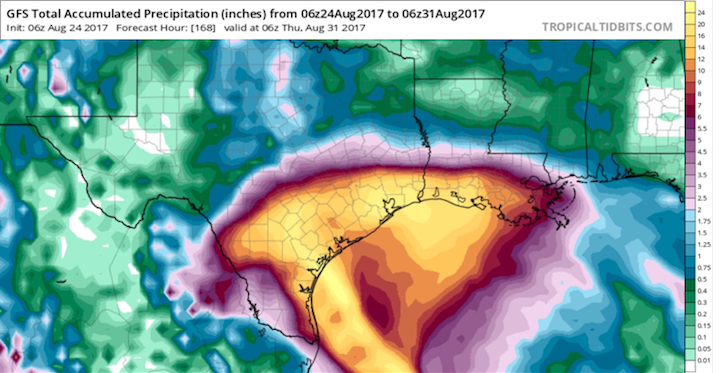
Rain: All of our top models are predicting that Harvey will dump more than ten inches of rain in a 5-day period in coastal Texas near where the center makes landfall. Some areas will likely receive 2 – 3 feet of rain over a 7-day period. Harvey has the potential to cause very serious flooding in such highly populated, flood-prone regions as the Austin-San Antonio corridor and the Houston metro area.
Storm Surge: Harvey’s peak storm surge of 6 – 10 feet is not expected to be as large or as devastating as Hurricane Ike’s in 2008, but will be very dangerous nonetheless. The highest storm surge on record at Corpus Christi is 12 feet, which occurred during the Atlantic-Gulf Hurricane of 1919.
 |
| Figure 6. Because of the very slow projected movement of Harvey, the 06Z Thursday run of the GFS model generates a wide swath of rainfall totals over the next week. Projected totals exceed 12" across much of southern Texas and southwest Louisiana, including parts of the Austin-San Antonio area and the region around Houston. Localized amounts may exceed 24", according to the GFS. Image credit: tropicaltidbits.com. |
 |
| Figure 7. Tropical Storm Harvey as seen by the GOES-16 satellite at 10:15 am CDT Thursday, August 24, 2017. Image credit: NOAA/CIRA/RAMMB. NOAA’s GOES-16 satellite has not been declared operational and its data are preliminary and undergoing testing. |
Bob Henson contrinuted to this post.


