| Above: Number of days per year with a high temperature above 90°F during the period 2036–2065 as compared to 1976–2005, under the highest of the emissions scenarios used by the IPCC (RCP8.5). The maps show the average (mean) from 32 climate model projections. Most parts of the U.S. are projected to get several dozen more 90°F days per year by the middle of this century. The results are statistically significant throughout the contiguous United States. Image credit: CICS-NC and NOAA NCEI, via Figure 6.9 of Chapter 6, Climate Science Special Report (CSSP). |
Humans are likely responsible for 93 - 123% of Earth’s net global warming after 1950, says a blockbuster climate report issued on Friday. The Climate Science Special Report is the first product released by the Fourth National Climate Assessment (NCA); the core assessment itself, focusing on impacts, will be released in 2018. The NCA is a congressionally mandated quadrennial effort by hundreds of U.S. scientists to assess how the climate is changing in the United States. The project is carried out by the U.S. Global Change Research Program. Preparation of the report included workshops around the nation, a public-comment period on the draft, and a technical review spanning 13 agencies.
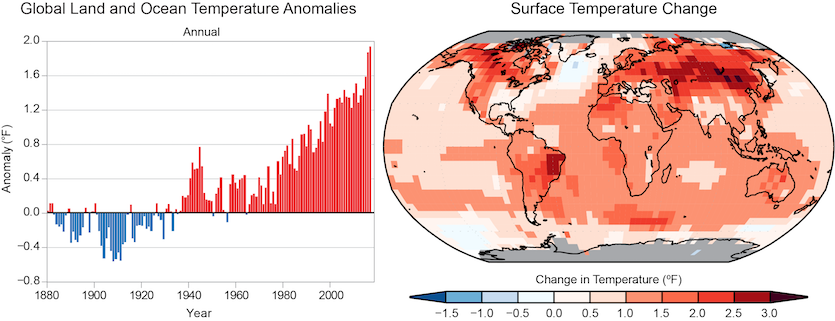 |
| Figure 1. (left) Global annual average temperature has increased by more than 1.2°F (0.7°C) for the period 1986–2016 relative to 1901–1960. Red bars show temperatures that were above the 1901–1960 average, and blue bars indicate temperatures below the average. (right) Surface temperature change (in °F) for the period 1986–2016 relative to 1901–1960. Gray indicates missing data. Image credit: Figures 1.2 and 1.3 of Chapter 1, Climate Science Special Report. |
A strong answer for climate-science-denying politicians
Ever since the Earth recorded three consecutive warmest years on record—2014, 2015, then 2016—the mantra of climate-science-denying politicians has shifted from “it hasn’t warmed since 1998” to “Earth’s climate has always changed, and we are not sure how much humans are to blame for the current warming.” At least three members of President Trump’s cabinet gave a variation of this message in their Congressional confirmation hearings. Well, we now have a new authoritative range on what the human contribution to global warming is: 93 – 123% of the warming since 1951. Chapter 3, Detection and Attribution of Climate Change (p.160) of the new report states:
“The likely range of the human contribution to the global mean temperature increase over the period 1951–2010 is 1.1° to 1.4°F (0.6° to 0.8°C), and the central estimate of the observed warming of 1.2°F (0.65°C) lies within this range (high confidence). This translates to a likely human contribution of 93%–123% of the observed 1951–2010 change.”
In other words, Earth might well have cooled slightly during this period if it were not for human activity; this makes Earth’s recent record-high temperatures even more startling. The report adds:
“For the warming over the last century, there is no convincing alternative explanation supported by the extent of the observational evidence.”
It is worth noting that this new report is even stronger on the human-caused component of warming than the 2013 Intergovernmental Panel on Climate Change (IPCC) report, prepared once every six years. The 2013 IPCC report had this to say about the observed warming of Earth since 1950:
“The best estimate of the human-induced contribution to warming is similar to the observed warming over this period.."
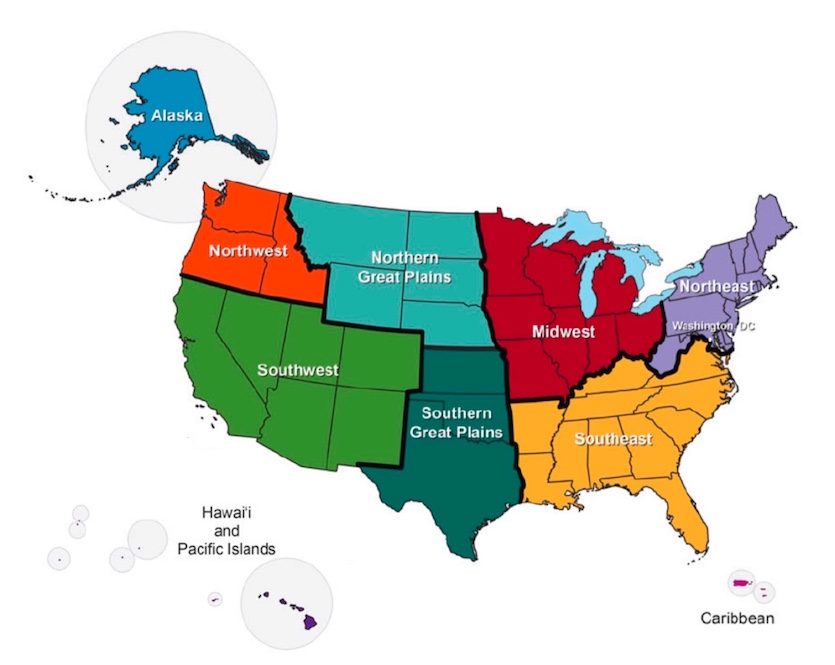 |
| Figure 2. The ten U.S. regions employed in the Climate Science Special Report and the upcoming Fourth National Climate Assessment. There are two new regions since the last assessment: the Caribbean has been broken off from the Southeast, and the Great Plains have been split into two regions. Image credit: Figure 1 of Guide to this Report, CSSR. |
Major U.S. conclusions in the new report
Next year’s full assessment will dig deeper into national impacts, but the Climate Science Special Report has plenty of detail on how climate change is already affecting the United States and what the future may hold. As shown in Figure 2, the analysis is broken into 10 regions. Here are just a few of the key findings:
Warmest in more than a thousand years. A major paleoclimate study has shown that for each of the world’s seven major continental regions, the average temperature for 1971-2000 was the highest in more than 1300 years. There is significant uncertainty around these estimates, but a separate study found that temperate North America as a whole (including most of the contiguous U.S.) is having its warmest 30-year periods in at least 1500 years.
It’s going to get a lot warmer in the coming decades. Temperatures across the contiguous U.S. have risen about 1.8°F (1.0°C) over the period 1901-2016. “Surface and satellite data are consistent in their depiction of rapid warming since 1979,” the report notes. By the period 2070-2100 (when today’s infants will be elders), U.S. temperatures may be 2.8 to 7.3°F warmer than the 1976-2005 average if greenhouse-gas emissions are reined in strongly—or 5.8 to 11.9°F warmer if emissions continue to grow at the pace of recent decades.
The U.S. temperature record still bears the imprint of the 1930s Dust Bowl. The coldest single day of the year was higher in all U.S. regions during 1986-2016 as compared to 1901-1960: from 1.13°F warmer in the Southeast to 4.78°F in the Northwest. Perhaps surprisingly, the warmest day of the year turned slightly cooler in all regions but the Southwest. One big reason: the 1930s Dust Bowl, exacerbated by poor land management, produced some extremely hot summer days. Warming in recent decades becomes much more evident when looking at daily record highs and lows. The ratio of hot to cold records has been more than 2 to 1 during the last two decades: in 2016 it was about 5 to 1, and for 2017 thus far, it’s running at more than 3 to 1. Continued warming in the 21st century should eventually transcend the Dust Bowl hangover, the report indicates: "the coldest and warmest daily temperatures of the year are expected to increase at least 5°F (2.8°C) in most areas by mid-century, rising to 10°F (5.5°C) or more by late-century."
It’s getting wetter, but not everywhere. Average precipitation for the nation as a whole has increased by about 4% since 1901. This is mainly due to large increases in autumn (see Figure 3). Overall, precipitation has decreased over much of the West, Southwest, and Southeast, and increased over most of the Great Plains, Midwest, and Northeast.
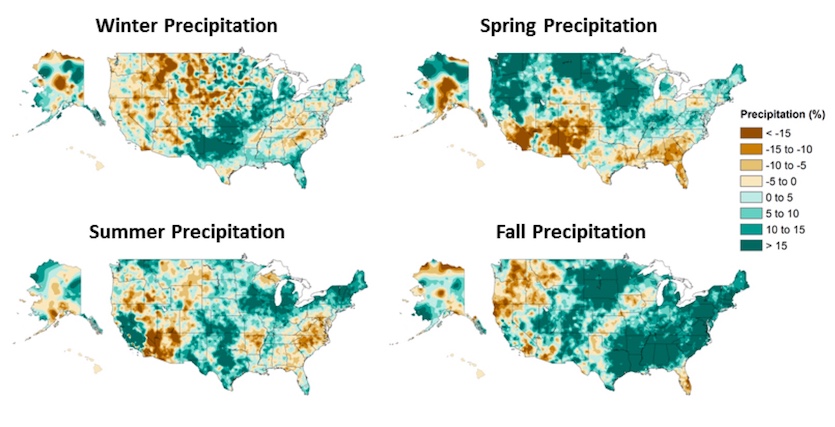 |
| Figure 3. Seasonal changes in precipitation, comparing the period 1986-2015 to the period 1901-1960 for the contiguous U.S. and to 1925-1960 for Alaska and Hawaii. Image credit: NOAA/NCEI, via Figure 7.1 of Chapter 7, CSSR. |
The biggest precipitation events are getting bigger. Between 1901 and 2016, the amount of moisture one would get on the wettest day across a five-year period has increased by anywhere from 1% in the Southwest to 27% in the Northeast. The jumps are even larger for the period 1958 – 2016, when considering the amount of moisture falling in the top 1% of all wet days: from a 9% increase in the Northwest to 55% in the Northeast (although Hawaii and the Caribbean saw drops of 11% and 12%, respectively).
Heat is making U.S. drought worse. The new report finds little evidence for a human influence on observed precipitation deficits—i.e., meteorological drought. Importantly, the study did find ample evidence that the impact of drought on soil moisture is increasing, because of warmer temperatures drawing more moisture out of plants and soil. This is exactly the process implicated in California’s destructive drought of 2011-2016.
Wetter north, drier south? Winter and spring are projected to get wetter on average in the northern U.S., including Alaska. However, parts of the Southwest may see a decrease in winter and spring moisture. As the century rolls on, we’re likely to see a continued increase in the frequency and intensity of heavy precipitation events (see Figure 4 below).
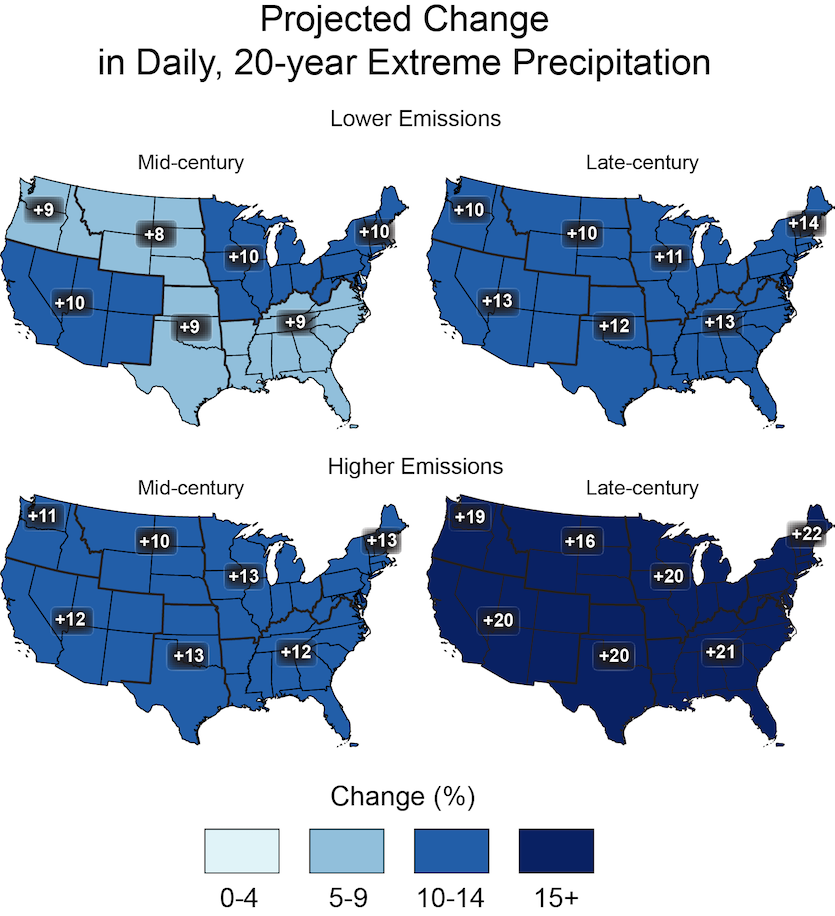 |
| Figure 4. Projected change in the amount of precipitation one would expect on the wettest day in a 20-year period for the mid-21st century (left maps) and late-21st century (right maps). Results are shown for a lower-emission scenario (top maps; RCP4.5) and for a higher-emission scenario (bottom maps, RCP8.5). Image credit: CICS-NC and NOAA NCEI, via Figure 7.7 of Chapter 7, CSSR. |
Big regional differences in sea level rise along U.S. coastline
For vast numbers of people living along or near the U.S. coast, no aspect of climate change will be more wrenching than sea level rise. One of the biggest advances in the ongoing National Climate Assessment is its treatment of sea level rise. This week’s report incorporates some of the latest findings on global mean sea level and how it could climb far more than earlier expected. The main reason: ice sheets in Antarctica may melt more quickly than once thought, especially if the ice cliffs and shelves along the Antarctic Ice Sheet become unstable and prone to fracturing.
Global mean sea level rose about 4-5 inches (11-14 cm) from 1901 to 1990, and about 3 inches (7 cm) in the comparatively brief period since 1990. The rate could accelerate much more this century based on six scenarios identified by the U.S. Interagency Sea Level Rise Task Force. The task force estimates (shown below) are similar to those now being used by the U.S. Department of Defense for planning all coastal facilities worldwide. The low end is comparable to a linear extension of the recent rate (about 0.12 in/year), while the high end is a very-bad-case scenario, including rapid ice loss in Antarctica.
Projected rises in global mean sea level from 2000 to the year shown:
Low: 0.2’ by 2020, 0.5’ by 2050, 1.0’ by 2100
Intermediate: 0.3’ by 2020, 1.1’ by 2050, 3.3’ by 2100
High: 0.4’ by 2020, 1.8’ by 2050, 6.6’ by 2100
Extreme: 0.4’ by 2020, 2.1’ by 2050, 8.2’ by 2100
(with further rises expected after 2100)
Each of these numbers is a global average, but there’s actually a surprising amount of variation in the height of the sea from one place to another. At either end of the tropical Pacific, for example, El Niño and La Niña can drive sea level up or down by a few inches for months by altering the surface winds that push water across the region. Long-term climate change will bring its own set of region-by-region differences to sea level rise (see Figure 5).
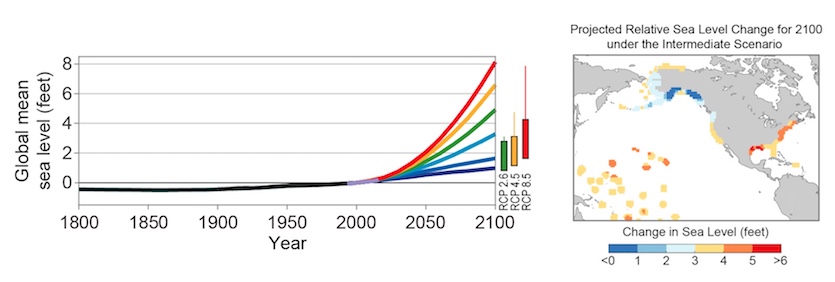 |
| Figure 5. Left: Global mean sea level (GMSL) rise from 1800 to 2100, based on six scenarios from the U.S. Interagency Sea Level Rise Task Force (navy blue, royal blue, cyan, green, orange, and red curves). Also shown are the very likely ranges in 2100 for different RCPs (colored boxes), and lines augmenting the very likely ranges by the difference between the median Antarctic contribution of Kopp et al. and the various median Antarctic projections of DeConto and Pollard. Right: Relative sea level (RSL) rise (feet) in 2100 projected for the Interagency Intermediate Scenario (a rise of 1 meter [3.3 feet] in global mean sea level by 2100). Image credit: Sweet et al. 2017, via Figure 12.4 of Chapter 12, CSSR. |
For the first time, the U.S. National Assessment is analyzing and projecting regional differences in sea level rise along the nation’s coasts, as shown in Figure 5 above. A few of the factors involved:
U.S. coasts will experience more than the global average sea level rise from Antarctica Ice Sheet melt, and less than the global average from Greenland Ice Sheet melt. These results are both produced by what’s called static-equilibrium effects—basically, how the planet’s gravity and rotation are affected by moving huge volumes of water from polar ice sheets into the global oceans.
The Northeast U.S. coast is expected to see additional sea level rise because of a gradually weakening Atlantic meridional overturning circulation, which helps power the Gulf Stream. Much as the polar jet stream separates air masses of different densities, the Gulf Stream separates warmer, less-dense water and higher sea levels on its southeast side from denser, cooler water and a lower sea level on its northwest side, toward the Northeast U.S. coast. Any long-term weakening of the Gulf Stream would be associated with a reduced sea-level gradient, and that would mean a drop in sea level toward the southeast and a rise toward the northwest (on top of any global-scale changes, of course).
Regional sea level rise is being exacerbated by withdrawals of groundwater off the Atlantic coast, and withdrawals of both fossil fuels and groundwater off the Gulf Coast. If these continue, so will the regional effects.
Sea level could rise at a pace below the global average along the coasts of Alaska and the Pacific Northwest. As the glaciers of Alaska melt, the land beneath them will rebound; this will also cut back on sea level rise over the Pacific Northwest due to the static-equilibrium effects noted above.
Coastal storms such as hurricanes and nor’easters will complicate the effects of sea level rise, as they bring their surges atop an ever-rising foundation of mean sea level. “A projected increase in the intensity of hurricanes in the North Atlantic could increase the probability of extreme flooding along most of the U.S. Atlantic and Gulf Coast States beyond what would be projected based solely on [regional sea level] rise,” the report notes. On top of this, there are nonlinear effects that could increasingly exacerbate storm surge heights in areas where the near-coast topography is shallow.
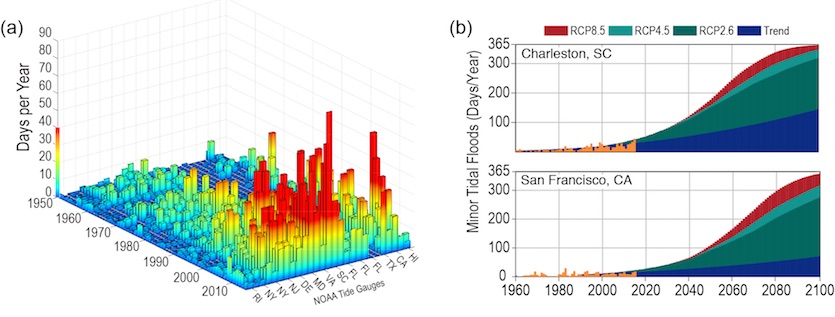 |
| Figure 6. (a) Tidal floods (days per year) exceeding NOAA thresholds for minor impacts at 28 NOAA tide gauges through 2015. (b) Historical exceedances (orange), future projections through 2100 based upon the continuation of the historical trend (blue), and future projections under median conditions for low, medium, and high emission scenarios, for two of the locations: Charleston, SC and San Francisco, CA. Image credit: (a) adapted from Sweet and Marra 2016, (b) adapted from Sweet and Park 2014; via Fig. 12.5 of Chapter 12, CSSR. |
Sea level rise is already having an effect on the U.S.
The impacts of sea level rise are not limited to future decades—they’re happening right in front of us, right now. “Nuisance” flooding has become a growing problem in places ranging from Miami Beach to San Francisco. In Maryland, both Annapolis and Baltimore now get more than nine times the number of flood days they experienced in the 1960s. For another example, see weather.com’s powerful report on Naval Station Norfolk (Virginia), a massive base that now experiences routine floods at high tide. Naval Station Norfolk could eventually flood on 200 days a year, based on current trends. However, efforts to keep up with the rising tide are mainly worked into ongoing projects rather than handled as priorities of their own.
The Norfolk report is part of weather.com’s “United States of Climate Change” series, which is examining major climate-change impacts in each of the 50 U.S. states—a very fitting complement to the new NOAA report.
Dr. Jeff Masters co-wrote this post.


