| Above: A tropical wave over the Leeward Islands and Puerto Rico, as seen at 11:15 am EDT August 29, 2018. Image credit: NOAA/RAMMB. |
A tropical wave located on Wednesday afternoon near the Leeward Islands and Puerto Rico was headed west to west-northwest at 10 – 15 mph. This system has the potential to develop into a tropical depression early next week in the waters surrounding Florida. The Gulf of Mexico waters along Florida's west coast are at higher risk to see development than the waters along Florida's east coast. Satellite images on Wednesday afternoon showed that the wave was generating a moderate amount of heavy thunderstorms, but the system had very little spin. High wind shear of 40 knots was very unfavorable for development, and the wave is expected to continue to battle high shear through Saturday as it moves into The Bahamas. None of the operational versions of our top three models for predicting tropical cyclone genesis--the European, GFS, and UKMET models--predicted in their 0Z Wednesday runs that this wave would develop into a tropical depression by Saturday. The National Hurricane Center (NHC) did not mention it in their 2 pm EDT Wednesday Tropical Weather Outlook.
For the first time this #hurricane season, both weekly tropical ocean temperatures and Caribbean wind shear are running near average. Notable developments, especially as we approach historical peak season activity. pic.twitter.com/S3CghXGaLW
— Michael Lowry (@MichaelRLowry) August 29, 2018
On Sunday through Tuesday, when the wave will be approaching the Florida east coast, then crossing Florida into the eastern Gulf of Mexico, the 0Z Wednesday run of the European model and about 30% of its 50 ensemble members predict a drop in wind shear that will allow the wave to organize into a tropical depression. The 0Z and 12Z Wednesday runs of the GFS and UKMET models show wind shear remaining high, and do not develop the wave over the next week. However, about 20% of the 20 members of the 0Z Wednesday GFS ensemble forecast did show development in the Gulf of Mexico early next week. Given the persistent forecasts of development by the European model over multiple runs over the past few days, plus some support from the GFS ensemble runs, this system deserves 10% odds of development over the next five days. The next name on the Atlantic list of storms is Florence.
 |
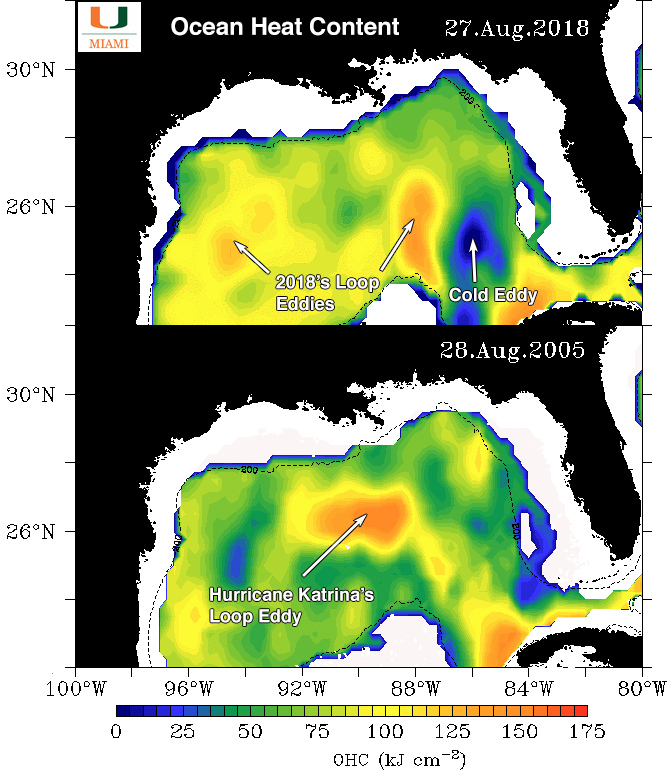
| Figure 1. A comparison of Ocean Heat Content (OHC) levels in the Gulf of Mexico in late August in 2018 (top) compared to 2005. There are two Loop Current eddies in the Gulf this year, compared to one in 2005. There was more OHC in 2018 compared to 2005, though the Loop Current eddy that fueled Hurricane Katrina was slightly larger with more heat energy than the main 2018 Loop Current eddy. Note also the presence of a pronounced cold eddy in 2018; any hurricane passing over this cold eddy will see a sudden reduction in the heat energy available to it. Image credit: University of Miami Rosenstiel School of Marine and Atmospheric Science. |
Near-record heat energy in the Gulf of Mexico
If the wave does encounter a low-shear environment in the Gulf of Mexico next week, it has a near-record amount of heat energy in the waters to feast on. Sea surface temperatures (SSTs) in the Gulf of Mexico are a very warm 30°C (86° F), which is about 1°C (1.8°F) above average. As I described in detail in our July 24 post, “High Octane Fuel in the Gulf of Mexico: 2 Loop Current Eddies”, the Gulf of Mexico has near-record amounts of heat energy, thanks to the presence of two warm Loop Current eddies. The total amount of heat energy in the Gulf right now is at near-record levels for this time of year—similar to last year’s levels, and much higher than observed during the awful hurricane season of 2005.
Loop Current eddies can provide a vast reservoir of energy to any hurricane that might cross over. This occurred in 2005, when a Loop Current eddy separated in July, just before Hurricane Katrina passed over and "bombed" into a Category 5 hurricane. The eddy remained in the Gulf and slowly drifted westward during September. Hurricane Rita passed over the same Loop Current eddy three weeks after Katrina, and also explosively deepened to a Category 5 storm. Hurricane Harvey of 2017 was also fueled by a Loop Current eddy that had migrated to the coast of Texas, a full 16 months after it had broken off from the Loop Current. This heat energy contributed to Hurricane Harvey’s record rains, as detailed in a 2018 paper by Kevin Trenberth of the National Center for Atmospheric Research, Hurricane Harvey Links to Ocean Heat Content and Climate Change Adaptation.
 |
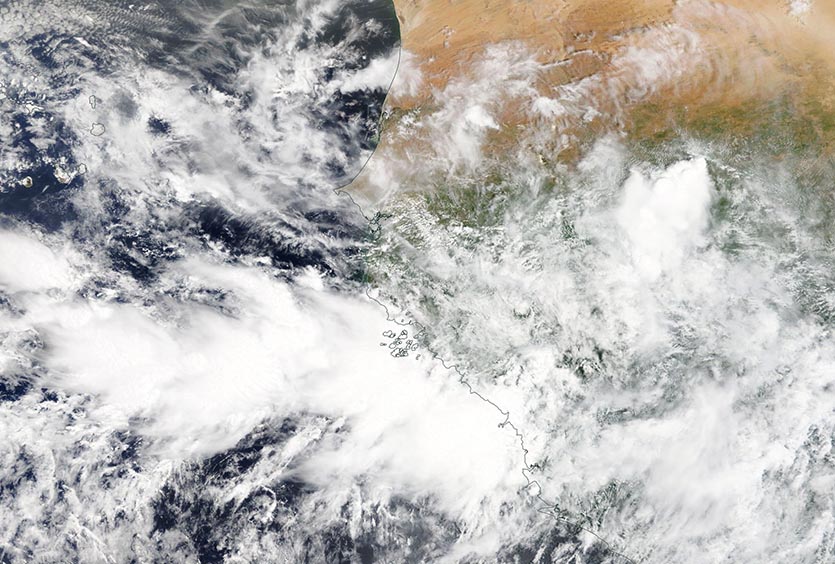
| Figure 2. MODIS visible satellite image of a tropical wave nearing the west coast of Africa on Wednesday morning, August 29, 2018. This wave is likely to develop into a tropical depression this weekend or early next week, in the waters near or west of the Cabo Verde Islands. Image credit: NASA Worldview. |
Friday’s African wave: likely to develop
According to the 0Z Wednesday runs of the GFS and European models and their ensembles, as well as the UKMET model, a tropical wave that will emerge from the coast of Africa on Thursday night or Friday morning is likely to develop into a tropical depression this weekend. Favoring development are warm sea surface temperatures (SSTs) near 29°C (82°F), and the fact that the dry air and dust of the Saharan Air Layer (SAL) lies well to the north of the tropical wave. Wind shear over the eastern tropical Atlantic is predicted to be a moderate 10 – 15 knots this weekend, and all of the models show some development of this wave in the waters near the Cabo Verde Islands off the coast of Africa, as early as Saturday. The GFS model appears to be too aggressive in development of this wave, showing it becoming a tropical depression almost immediately after exiting the coast of Africa. The European model solution, showing development 24 – 36 hours after the wave emerges over water, is more realistic. In either case, the wave is likely to bring rainfall amounts of 2 – 4” to the Cabo Verde Islands over the weekend, and residents there should monitor this system. In their 2 pm EDT Wednesday Tropical Weather Outlook, the National Hurricane Center (NHC) gave this wave 2-day and 5-day odds of development of 30% and 60%, respectively. This wave is emerging far enough to the north that it is unlikely to be a storm that will affect the Caribbean.
 |
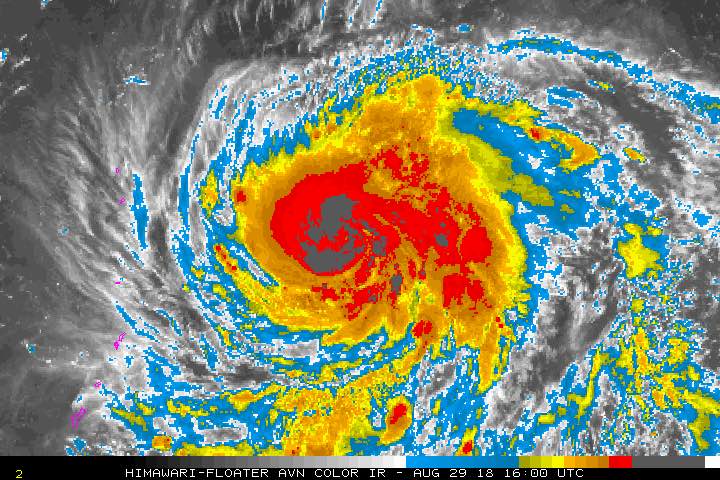
| Figure 3. Infrared satellite image of Typhoon Jebi taken at noon EDT August 29, 2018. Image credit: NOAA. |
Typhoon Jebi headed towards Japan
In the Northwest Pacific, Typhoon Jebi has formed, and will likely threaten Japan next week. The typhoon is expected to intensify into a major typhoon by Thursday, when it will be passing about 300 miles northeast of Guam in the Northern Mariana Islands. Both the GFS and European models have been consistently predicting that Jebi will threaten Japan by the middle of next week. The 11 am EDT Wednesday forecast from the Joint Typhoon Warning Center calls for Jebi to peak as a Category 4 storm with 130 mph winds on Friday, then slowly weaken to a Category 3 storm with 115 mph winds by Tuesday.
 |
| Figure 4. The highest rainfall totals reported from tropical cyclones in each contiguous U.S. state through 2017. Image credit: NOAA/NWS Hydrometeorological Prediction Center, via Wikimedia Commons. |
Lane squeezes out the heaviest rain on record from a tropical cyclone in Hawaii
Even though it never made landfall, Hurricane Lane made history by producing the heaviest rainfall ever measured during a tropical cyclone in Hawaii. Mountain View, on the eastern slopes of Hawaii’s Big Island, reported 52.02” from 8 am HST August 22 to 8 am August 26. This breaks the previous Hawaii record (but just barely!) of 52.00”, recorded during Hurricane Hiki in August 1950 at Kanalohuluhulu Ranger Station. A Personal Weather Station in Keaau, southeast of Hilo, reported an even greater rainfall total: 58.80” over the same period. The National Weather Service has contacted the owner of this station and intends to test the calibration of the rain gauge to see if it was accurate.
Lane Possibly Breaks Hawaii Tropical Cyclone Rainfall Record!! click on link to see other notable rainfall totals https://t.co/6TwCtqSnhe pic.twitter.com/nh15GhFwnV
— NWSHonolulu (@NWSHonolulu) August 28, 2018
The only confirmed local total from a tropical cyclone anywhere in the United States higher than the 52.02” at Mountain View was the 60.58” recorded almost a year ago at Nederland, in far southeast Texas, during Hurricane Harvey. Although Harvey and Lane share some similarities—both were slow-moving hurricanes whose biggest impacts came from rainfall—Harvey produced far more rain overall across land than Lane. It also managed that feat without any help from winds blowing upslope against higher terrain, which squeezes out moisture.
Keeping an eye on two tropical storms in the Northeast Pacific
Two systems in the Northeast Pacific pose no immediate threat to land. Tropical Storm Miriam could briefly become a hurricane in the next day or two before it recurves northward, staying about 500 miles east of the Hawaiian Islands. Further east, Tropical Storm Norman could become a much more fearsome cyclone, with the official NHC forecast making it a Category 3 storm by Friday. Norman's zig-zaggy westward path will keep it heading in the general direction of Hawaii through at least the weekend, although computer models are suggesting that it would most likely recurve next week before threatening the islands.
Bob Henson contributed the Lane and Eastern Pacific sections of this post.


