
| Above: The deadliest weather-related disaster of September 2018 was flooding in Nigeria which killed 199 people and caused over $275 million in damage. The worst damage occurred along the Niger and Benue rivers, the main watercourses in Nigeria. Above: A dugout canoe is used to cross a flooded section of Lokoja, Kogi State, Nigeria on September 19, 2018. Image credit: Sodiq Adelakun/ AFP/Getty Images. |
September 2018 was tied with 2017 as the planet's fourth-warmest September since record keeping began in 1880, said NOAA's National Centers for Environmental Information (NCEI) on Wednesday. The only warmer September months came in 2015, 2016, and 2014, according to NOAA. NASA rated September 2018 as tied for the sixth-warmest September on record. Minor differences in rankings between NASA and NOAA arise mostly due to how they handle data-sparse regions such as the Arctic, where few surface weather stations exist.
Global ocean temperatures during September 2018 were the fourth warmest on record, and land temperatures were the sixth warmest on record, according to NOAA. Satellite-measured temperatures for the lowest 8 km of the atmosphere were the 15th and 12th warmest in the 40-year record, respectively, according to the University of Alabama Huntsville (UAH) and RSS.
With latest update from @NASAGISS, 2018 is almost guaranteed to be the 4th warmest year in the record, and likely to be (~76%) the 4th year in a row more than 1ºC above the late 19th Century. (1ºC = 1.8ºF ~ ¼ of an ice age unit) pic.twitter.com/Kl8lCFVVjA
— Gavin Schmidt (@ClimateOfGavin) October 15, 2018
The year-to-date period of January – September now ranks as the fourth warmest on record, and it is increasingly likely that the five warmest years on record globally will be 2014 through 2018. If an El Niño develops later this winter, as predicted, that will give 2019 a very good chance of giving us six straight years that are each among the top six warmest years on record, barring a massive climate-cooling volcanic eruption in the tropics.
 |
| Figure 1. Departure of temperature from average for Septembers from 1895 to 2018. The five warmest Septembers for the globe since record keeping began in 1880 have all occurred in the past five years. Image credit: National Centers for Environmental Information (NCEI). |
 |
| Figure 2. Regional departures from average temperature for September 2018. Record warm temperatures were present across parts of western Alaska and its surrounding ocean, Far East Russia, the Barents Sea, as well as across parts of the Atlantic Ocean, southern South America, western Indian Ocean, Europe, and the Middle East. Record cold September temperatures were observed in southwestern Canada. Europe had its warmest September on record, South America its second warmest, and Africa and Asia their third and fourth warmest, respectively. Australia had its driest September on record. Image credit: National Centers for Environmental Information (NCEI). |
Four billion-dollar weather disasters in September 2018
Four billion-dollar weather-related disasters hit the Earth last month, according to the September 2018 Catastrophe Report from insurance broker Aon Benfield: Hurricane Florence in the U.S. ($10+ billion), drought in India ($1.1 billion), Typhoon Jebi in Asia ($2+ billion), and Typhoon Manghut in Asia ($2+ billion). In addition, damage claims from Typhoon Rumbia in China topped the $1 billion mark by the end of September, giving the planet 27 billion-dollar weather disasters so far in 2018. This already ranks as the seventh highest yearly total since 1990, according to Aon Benfield, with three months to go in the year.
- Hurricane Florence, Southeast, Mid-Atlantic U.S., 9/14 – 9/19, $10+ billion, 53 killed
- Drought, Northern and Central Europe, 5/1 – 8/31, $7.5 billion, 0 killed
- Flooding, Japan, 7/5 – 7/8, $7 billion, 230 killed
- Flooding, India, 8/7 – 8/20, $5.5 billion, 500 killed
- Drought, Argentina and Uruguay, 1/1 – 3/31, $3.9 billion, 0 killed
- Typhoon Rumbia*, 8/16 – 8/18, $3.1 billion, 22 killed
- Winter Storm Friederike, Western & Central Europe, 1/18, $2.75 billion, 13 killed
- Severe Weather, Rockies, Plains, Midwest, Northeast U.S., 6/17 – 6/21, $2.4 billion, 0 killed
- Winter Storm Riley, Eastern U.S., 3/1 – 3/3, $2.3 billion, 9 killed
- Typhoon Mangkhut, China, Hong Kong, Philippines, 9/15 – 9/18, $2+ billion, 131 killed
- Typhoon Jebi, Japan, 9/4 – 9/5, $2+ billion, 17 killed
- Drought, U.S., 1/1 – 9/30, $2 billion, 0 killed
- Winter Weather, China, 4/2 – 4/18, $1.5 billion, 0 killed
- Severe Weather, Plains, Southeast, Northeast U.S., 3/18 – 3/21, $1.5 billion, 0 killed
- Severe Weather, Rockies, Plains, Midwest, Northeast U.S., 5/12 – 5/16, $1.45 billion, 0 killed
- Severe Weather*, 4/28 – 5/5 Plains, Midwest U.S., $1.4 billion, 0 killed
- Wildfire, California (U.S.), 8/1 – 8/31, $1.3 billion, 14 killed
- Flooding, China, 5/1 – 6/30, $1.3 billion, 108 killed
- Winter Storms Eleanor & Carmen, Western & Central Europe, 1/1 – 1/4, $1.3 billion, 7 killed
- Severe Weather, Plains, Midwest, Southeast, Northeast U.S., 4/13 – 4/17, $1.3 billion, 6 killed
- Drought, South Africa, 1/1 – 5/31, $1.2 billion, 0 killed
- Drought, Australia, 1/1 – 8/1, $1.2 billion, 0 killed
- Severe Weather*, 6/3 – 6/7, Plains, Midwest, Southeast U.S., $1.1 billion, 0 killed
- Winter Storm Grayson, Central & Eastern U.S., 1/3 – 1/5, $1.1 billion, 22 killed
- Winter Weather, China, 1/24 – 1/29, $1.1 billion, 2 killed
- Drought, India, 6/1 – 10/1, $1.1 billion, 0 killed
- California wildfires, 7/24 – 8/1, $1 billion, 6 killed
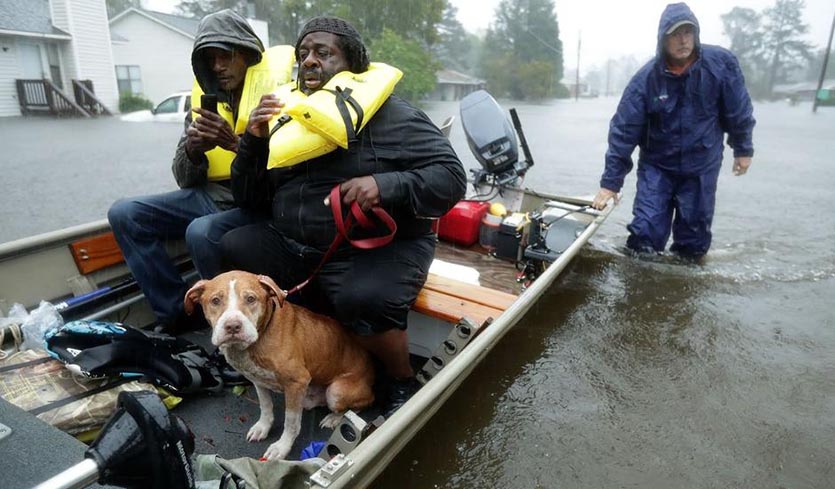 |
| September Billion-Dollar Disaster 1. Hurricane Florence made landfall at Wrightsville Beach, North Carolina on September 14 as a Category 1 hurricane with 90 mph winds. Florence brought a storm surge of 5 – 6’ along much of the south coast of North Carolina, and set all-time high-water marks at two of the region’s three tide gauges with long-term records. Florence slowed to a crawl as it moved inland, bringing record rains and record river flooding. More than 30” of rain was recorded at several North Carolina stations, including 35.93” at Elizabethtown--an all-time record for the wettest tropical cyclone ever observed north of the Gulf Coast states. Heavy rainfall also occurred in South Carolina, with 23.63” observed near Loris--a new state record for rainfall from a tropical cyclone. At least 53 direct or indirect deaths were blamed on the storm. Total economic losses will exceed $10 billion, though it will be months until the full scope is realized. Above: Volunteers help rescue residents and their pet from their flooded home during Hurricane Florence September 14, 2018 in New Bern, North Carolina. Image credit: Chip Somodevilla/Getty Images. |
 |
| September Billion-Dollar Disaster 2. Typhoon Jebi made landfall in Western Japan near Osaka on September 4 as a Category 2 storm, causing widespread wind, storm surge, and flood damage. At least 17 people were killed, 600 were injured, and damages were expected to reach well into the billions of dollars. According to the JMA, Jebi was the strongest typhoon to strike Japan’s main island of Honshu since Typhoon Yancy of 1993. Above: Osaka’s Kansai International Airport on September 4, 2018, after Typhoon Jebi's storm surge inundated one runway and flooded Terminal 1. The airport was partially closed for 17 days after the typhoon. Image credit: Kentaro Ikushima/Mainichi Newspaper via AP. |
 |
| September Billion-Dollar Disaster 3. After doing damage in the U.S. territory of the Northern Mariana Islands as a Category 2 storm, Typhoon Mangkhut hit the Philippines on September 15 as a Category 5 storm with 165 mph winds, killing at least 127 and causing over $600 million in damage. Mangkhut then made landfall in Hong Kong and China on September 16 as a borderline Category 2/Category 3 storm, according to the China Meteorological Agency. Mangkhut was regarded as the strongest typhoon to strike Hong Kong since Typhoon Ellen in 1983, and did close to $2 billion in damage in Hong Kong and China. Above: Windows of a commercial building damaged by Typhoon Mangkhut on Sept. 16, 2018, in Hong Kong. City officials raised the storm alert to T10, its highest level, as Typhoon Mangkhut landed on Hong Kong. (Lam Yik Fei/Getty Images). |
 |
| September Billion-Dollar Disaster 4. Widespread severe to exceptional drought gripped much of the state of Karnataka in southwest India in the summer of 2018, leading to at least $1.1 billion in agricultural losses. Above: On June 6, 2018, Indian residents use hoses to fill jerry cans with water from a distribution truck which arrives daily, in the low-income eastern neighborhood of Sanjay camp in Delhi. (Dominique Faget/AFP/Getty Images). |
El Niño conditions expected this winter
NOAA’s Climate Prediction Center (CPC) kept an El Niño Watch in place in its October 11 monthly advisory. Over the past week, sea surface temperatures (SSTs) in the benchmark Niño 3.4 region (in the equatorial Pacific) were 0.7°C above average. Temperatures 0.5°C above average are needed to be classified as a weak El Niño event, with the 3-month average temperature staying more than 0.5°C above average for five consecutive months.
 |
| Figure 3. Departure of sea surface temperatures (SSTs) in the benchmark Niño 3.4 region (in the equatorial Pacific). Image credit: Levi Cowan, tropicaltidbits.com. |
Odds for an El Niño event to form were predicted to be 70 – 75% for the coming winter (December-January-February), the time of year when El Niño events are typically at their strongest. These odds have increased since the September advisory, when a 65 - 70% chance was given. If an El Niño event does form, it is expected to be a weak one.
 |
| Figure 4. Monthly ranking of near-surface (925 mb) Arctic air temperature from 1979 to 2018 from the National Centers for Environmental Prediction/National Center for Atmospheric Research (NCEP/NCAR) Reanalysis for all areas north of 70 degrees N. Dark reds indicate warmest months; dark blues indicate coldest months. Image credit: Zachary Labe (@ZLabe), University of California, Irvine. |
Arctic sea ice: 6th-lowest September extent on record
After starting the year with record lows in January and February, Arctic sea ice extent ended tied with 2008 for the sixth lowest average September extent in the satellite record, according to the National Snow and Ice Data Center (NSIDC). The 2018 minimum extent was reached on both September 19 and 23. September 23 is among the latest dates for the seasonal minimum in the 40-year satellite record. While the Northern Sea Route along the north coast of Russia opened again this year, as it has every year since 2008, the Northwest Passage through the waters of the Canadian Arctic was not fully navigable, due to ice in the central section of the southern route between Bellot Strait and Gjoa Haven.
In the Antarctic, the annual maximum extent appears to have been reached on October 2. If the downward trend continues, it will be the fourth lowest maximum in the satellite record—higher than the 1986, 2002, and 2017 maxima.
Notable global heat and cold marks set for September 2018
Hottest temperature in the Northern Hemisphere: 50.7°C (123.3°F) at Basra Airport, Iraq, 1 September
Coldest temperature in the Northern Hemisphere: -45.3°C (-49.5°F) at Summit, Greenland, 21 and 22 September
Hottest temperature in the Southern Hemisphere: 44.4°C (111.9°F) at Skukuza, South Africa, 18 September
Coldest temperature in the Southern Hemisphere: -79.1°C (-110.4°F) at Dome A, Antarctica, 6 September
(Courtesy of Maximiliano Herrera.)
Major weather stations that set (not tied) new all-time heat or cold records in September 2018
None.
Five all-time national heat records broken in 2018
So far in 2018, five nations have broken an all-time record for hottest temperature in recorded history:
Palau: 95°F (35°C) at Koror on March 22
Algeria: 124.3°F (51.3°C) at Ourgla on July 5
Taiwan: 104.5°F (40.3°C) at Tianxiang on July 10
Japan: 106.0°F (41.1°C) at Kumagaya on July 23
South Korea: 105.8°F (41.0°C) at Hongcheon on August 1
No nations have set an all-time cold temperature record so far in 2018. Most nations do not maintain official databases of extreme temperature records, so the national temperature records reported here are in many cases not official. I use as my source for international weather records researcher Maximiliano Herrera, one of the world's top climatologists, who maintains a comprehensive list of extreme temperature records for every nation in the world on his website. If you reproduce this list of extremes, please cite Maximiliano Herrera as the primary source of the weather records.
Thirty-nine monthly national/territorial heat records so far in 2018
January: Marshall Islands
February: Marshall Islands, Falkland Islands, Kuwait, Qatar, Saudi Arabia, Palau
March: Marshall Islands, Qatar, Armenia, Madagascar, Pakistan, Iraq, UAE, Turkmenistan, Tajikistan, Uzbekistan
April: Albania, Montenegro
May: Hong Kong, Norway
June: Oman, Marshall Islands, Cocos Islands
July: Iran, Namibia, Indonesia, El Salvador, Jordan, Luxembourg, Netherlands, South Korea
August: Japan, Fiji
September: Qatar, Iraq
October: Japan, Finland, Thailand
(Courtesy of Maximiliano Herrera.)
One national monthly cold record set so far in 2018
September: Iceland
Continental/Hemispheric records in 2018
Highest temperature ever recorded in April in Asia: 50.2°C (122.4°F) at Nawabshah, Pakistan, 30 April
World record of the highest reliably-measured minimum temperature in 24 hours: 42.6°C (108.7°F) at Qurayyat, Oman, 26 June
African record of highest temperature: 51.3°C (124.3°F) at Ouargla, Algeria, 5 July
African record of the highest minimum temperature: 39.5°C (103.1°F) at Salah, Algeria, 29 July
Bob Henson contributed to this post.


