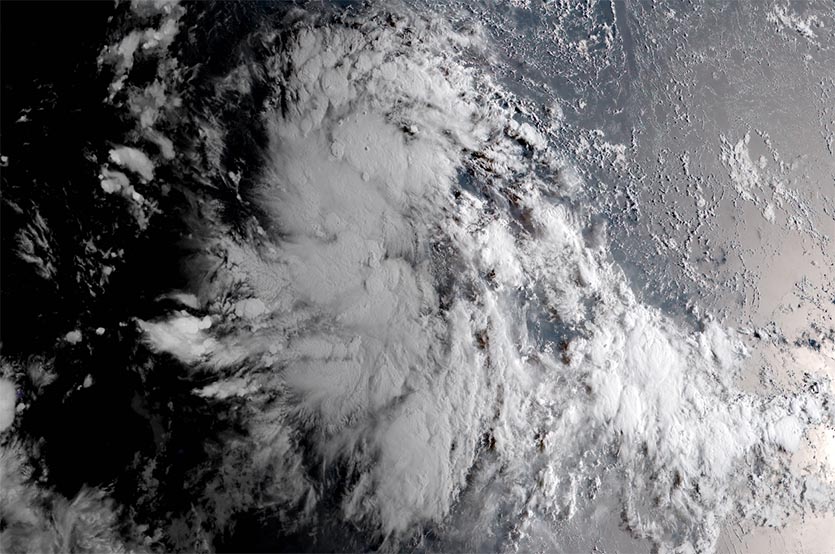
| Above: Infrared-wavelength satellite image of Olivia at 2235Z (6:35 pm EDT) Thursday, September 6, 2018. Image credit: tropicaltidbits.com. |
Back up to Category 3 strength on Thursday afternoon, Hurricane Olivia remains on a long-term course that looks increasingly likely to take it across the Hawaiian Islands. As of 5 pm EDT Wednesday, Olivia’s top sustained winds had increased to 125 mph, which rivals the peak strength the hurricane achieved on Tuesday night. Olivia was still just a bit closer to Mexico than to Hawaii—located about 1200 miles west of Cabo San Lucas—and was heading west-northwest at 14 mph. Update (11:30 pm EDT Thursday): Olivia has now attained Category 4 strength, as of 11 pm EDT, with top sustained winds of 130 mph.
Several hurricanes of late, including Florence in the Atlantic, have given intensity forecasts a run for their money. As recently as Wednesday, Olivia was expected to drop to Category 1 strength by now, given the dry atmosphere it’s been moving through (mid-level relative humidity around 45%). However, there are two big factors working in Olivia’s favor:
—the hurricane remains over sea surface temperatures (SSTs) around 27°C (81°F), which is just warm enough to sustain strengthening; and
—wind shear is very low: only about 5 knots, according to the 18Z Thursday run of the SHIPS statistical model.
 |
| Figure 1. Visible-wavelength satellite image of Olivia at 2235Z (6:35 pm EDT) Thursday, September 6, 2018. Image credit: tropicaltidbits.com. |
The outlook for Olivia
Wind shear will remain quite low for at least the next 3-4 days, which will help Olivia maintain its overall structure. The showers and thunderstorms (convection) fueling Olivia may take an increasing hit, though. SSTs along Olivia’s path will be dropping to around 25 – 26°C (77 - 79°F) by Saturday, which is near the benchmark minimum for tropical development. On top of this, Olivia will encounter increasingly dry air: relative humidities in the mid-level environment will be down to around 30% by Saturday, which is quite unfavorable for supporting a hurricane.
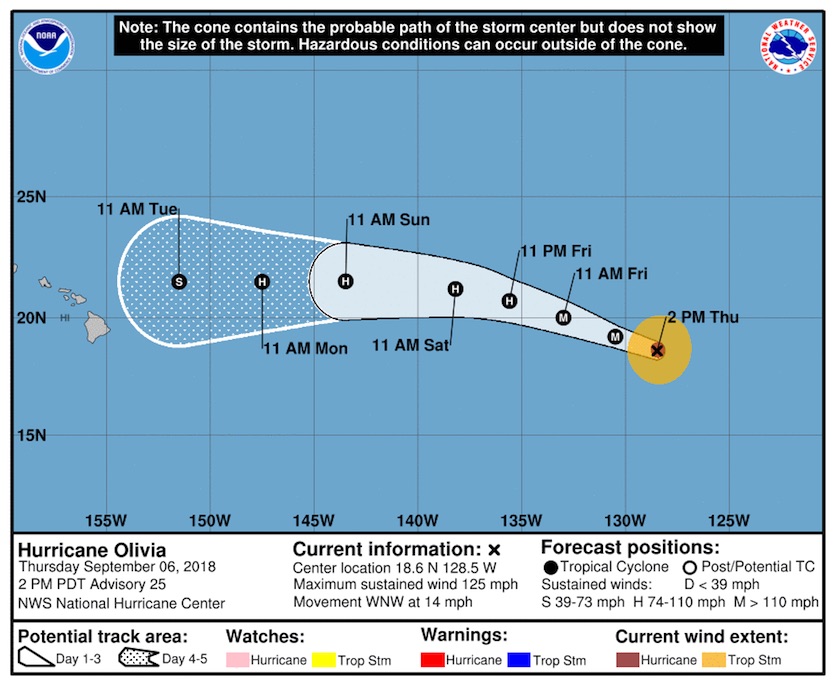
Given the very low wind shear, it’s possible the storm will maintain a protective pouch of higher humidity, in which case its convection might prove resilient and the storm could hold its own. Overall, though, it seems more probable that Olivia will gradually weaken over at least the next 2-3 days, as multiple models insist. Any such weakening trend could draw to a halt when Olivia crosses back over slightly warmer waters (near or just above 26°C) from Monday onward, especially if the storm’s overall structure remains intact. The NHC forecast issued at 5 pm EDT Thursday brings Olivia down to Category 1 strength by Saturday and high-end tropical storm strength by Tuesday.
 |
| Figure 2. Forecast for Olivia from the National Hurricane Center issued at 5 pm EDT Thursday, September 6, 2018. Image credit: NHC. |
It’s good news for Hawaii that Olivia is likely to weaken by early next week, because it’s quite possible the islands will get a rare direct hit. A tropical cyclone landfall is defined by NHC as "the intersection of the surface center of a tropical cyclone with a coastline." NHC adds: "Because the strongest winds in a tropical cyclone are not located precisely at the center, it is possible for a cyclone's strongest winds to be experienced over land even if landfall does not occur."
According to the NOAA Hurricane History site, only four tropical storms or hurricanes have made landfall in Hawaii since records began in 1949, and two of those have been in the last four years:
--Hurricane Darby made landfall along the southeast shore of Hawaii’s Big Island on July 23, 2016, as a minimal tropical storm (top sustained winds of 40 mph). Damage was minimal and there were no deaths from Darby.
--Tropical Storm Iselle, which, like Darby, made landfall along the southeast shore of the Big Island, arriving as a 60-mph tropical storm on August 8, 2014. Iselle killed one person and did $79 million in damage.
--Hurricane Iniki, which made landfall in Kauai as a Category 4 hurricane, killing 6 and causing $1.8 billion in damage (1992 dollars.)
--Hurricane Dot, which made landfall Kauai as a Category 1 hurricane, causing 6 indirect deaths and $6 million in damage (1959 dollars.)
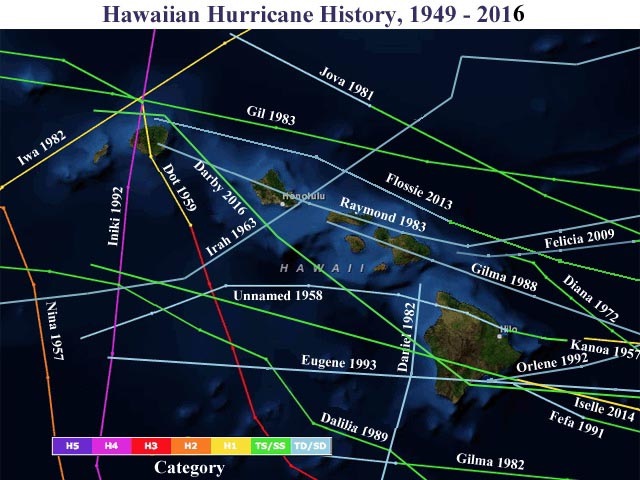
In addition, a unnamed 1958 storm moving across the northern Big Island is depicted as a tropical depression in Figure 3 below, but it appears to have been a tropical storm. According to the Central Pacific Hurricane Center, "At Hilo winds reached sustained speeds of 30 knots with gusts of 45 knots. In other areas of the island, as judged by damage, winds reached sustained speeds of at least 50 knots with gusts of 75 knots or more. On Maui, Lanai, Molokai, and Oahu, wind speeds exceeded 35 knots sustained and 50 knots in gusts in many different localities, again as judged by the resulting damage." The storm killed one person and caused $0.5 million in damage.
Along with these landfalling tropical cyclones, others have caused major damage in Hawaii without making landfall—most notably Hurricane Iwa in 1982, whose center stayed just northwest of Kauai but whose intense right-hand core passed directly over the island. Iwa caused more than $300 million in damage (1982 dollars) and at least 4 direct and indirect fatalities.
The region around Hawaii has seen a lot of tropical activity over the past four years, including a number of near-misses. Partly this is a result of El Niño, which warmed the waters of the tropical Central and Eastern Pacific where Hawaii-heading cyclones are born. However, the uptick may also be a harbinger of things to come. See the August 2014 post, Climate Change May Increase the Number of Hawaiian Hurricanes.
 |
| Figure 3. Tracks of all tropical cyclones (tropical depressions, tropical storms, and hurricanes) to pass within 100 miles of the Hawaiian Islands, 1949 - 2016. On July 25, 2016, Tropical Storm Darby made the closest approach on record by a tropical storm to Honolulu, passing just 40 miles to the south and west of Hawaii’s capital with sustained 40 mph winds. Darby brought torrential rains in excess of ten inches to portions of Oahu. Image credit: NOAA/CSC. |
Figure 3 shows that there is no precedent for a tropical storm or hurricane striking Hawaii from the east-northeast, yet Olivia could do just that. A upper low is predicted to intensify this weekend near the International Date Line and 40°N, followed by a very strong upper high just to the east by early next week. This high will block Olivia from turning north before reaching the islands, as most such storms do. Hurricane Miriam took such a turn several days ago, and Norman (still a high-end Category 2 storm) is turning northwest now. However, the 0Z and 12Z Thursday runs of the European model, and the 0Z, 6Z, 12Z, and 18Z runs of the GFS, all swing Olivia on a west or west-southwest track over some part of Hawaii. It’s too soon to be specific about which islands might be affected, or how strong Olivia might be, but the possibility of an unusual landfall is high enough that residents would be wise to think about early-preparedness planning.
Normally, the waters along Olivia’s predicted path toward Hawaii would be no warmer than the 26°C (79°F) benchmark for tropical development. Right now, though, the SSTs are 0.5°C to 1°C above average, just enough to push them into a more favorable temperature range. The parched air between Olivia and Hawaii will likely dry out the hurricane enough to cut its strength significantly before any possible landfall, but the low wind shear and warm water mean that we’ll need to keep a close eye on Olivia just to be sure. As of 5 pm EDT Thursday, the NHC forecast, which extends out for 120 hours, puts Olivia about 300 miles east of Honolulu by Tuesday afternoon, heading on a steady westward track as a high-end tropical storm. If this track forecast holds, parts of Hawaii will fall within the NHC “cone of uncertainty” by Friday.
 |
| Figure 4. Himawari-8 image of 99W at sunrise local time on September 7, 2018 (19Z September 6), over the Marshall Islands of the Northwest Pacific Ocean. Image credit: NOAA/RAMMB. |
Western Pacific’s 99W: a major typhoon in the making?
In the Northwest Pacific, a tropical disturbance getting organized near in the Marshall Islands near 12°N, 170°E (99W) promises to be a dangerous major typhoon next week, if recent runs of the GFS and European model are correct. The GFS model, in particular, has been going hog-wild intensifying 99W in the long-range, with some runs that are hard to believe (an 869 mb central pressure is not going to happen!)
Satellite loops show that the disturbance has an impressive amount of heavy thunderstorms that are steadily growing more organized, in a region where SSTs are a very warm 30° - 31°C (86° - 88°F), and where wind shear is a light 5 – 10 knots. Steering currents favor a west to west-northwest motion over the next ten days, which would bring the storm in the vicinity of the Philippines, Taiwan, and/or China in about ten days. We can’t rule out recurvature to the north and no land impacts at this early stage, though.
Epilogue for a steamy U.S. summer
NOAA issued its climate summaries for August and for meteorological summer (June-August) on Thursday, and heat is definitely the bold-type headline. It was the fourth warmest summer for the contiguous U.S. in records going back to 1895, and the warmest on record for Utah and Rhode Island as well as for dozens of towns and cities across the Southwest. Minimum temperatures (nighttime lows) were the warmest on record when averaged across the nation for the entire summer. This beats a record set just two years ago (see Figure 5), and it’s consistent with what global models have long told us to expect from human-produced climate change: more warming at night than during the day.
We’ll review the summer climate in more detail later this month, after the tropics calm down!
Dr. Jeff Masters wrote the 99W and Hawaii hurricane-history sections of this post.
 |
| Figure 5. Daily minimum temperatures averaged across the summer (June-August) for the 48 contiguous U.S. states show a marked and consistent upward trend in recent decades. The average summer low has climbed from about 58°F in the 1960s to 60-61°F in the 2010s. Image credit: NOAA National Centers for Environmental Information. |


