
| Above: Satellite view of the Great Lakes on a recent clear day (December 22, 2019), showing less than 2% overall ice cover, about normal for this point in the winter, mainly in Green Bay and Saginaw Bay. Image credit: NASA Worldview. |
The Great Lakes are an amazing natural resource that hold nearly 20% of the entire surface fresh water supply on the globe and a whopping 95% of the available fresh water supply for the US. I have always found the Great Lakes fascinating. For those who have never lived near them, or even seen them for that matter, it is sometimes difficult to comprehend the size of these inland fresh-water seas, which are the world’s largest as a group. They span a west-east distance of nearly 800 miles, greater than the distance from Chicago to New York. Their north-south coverage is over 500 miles, nearly the distance from Cleveland to Atlanta. About one-eighth of the U.S. population and one-third of the population of Canada live within their drainage basin. They hold about 6 quadrillion gallons of water, or enough to blanket the entire U.S. to a depth of over 9 feet!
Each lake, and their entire conglomerate, exhibits a profound influence on the weather and climate of the eastern half of our nation. Of course, on a regional scale, those relatively warm waters of the lakes are responsible for very heavy lake-effect snow during the late fall through much of the winter, giving places like Buffalo, NY a well-deserved reputation as a snow mecca. The relative heat produced by entire group of the lakes in the fall and winter can actually “deflect” or modify high pressure systems that try to build over the region, and it can often develop or enhance low pressure systems as well.
A quick look at two stations on either side of the lakes at about the same latitude drives these points home. Madison, Wisconsin, upwind of the Great Lakes, gets on average around 15 days each winter when the temperature drops below 0°F. In Buffalo, NY, immediately downwind of the Great Lakes, the temperature on average drops below 0°F only three days out of the winter. Madison averages about 51” of snow per year, whereas Buffalo gets upwards of 95” in a typical winter.
Because of their location in the midlatitudes, the Great Lakes experience the full effect of four seasons. At this time of the year, they begin to develop significant ice cover. The average annual ice cover over the Great Lakes region responds very closely to seasonal changes in annual temperature. However, each lake exhibits its own individual response and timescale regarding the growth of ice. That calendar is modulated by many factors, including how far north or south the lake is located, as well as the size and depth of each lake, and even its shape and orientation.
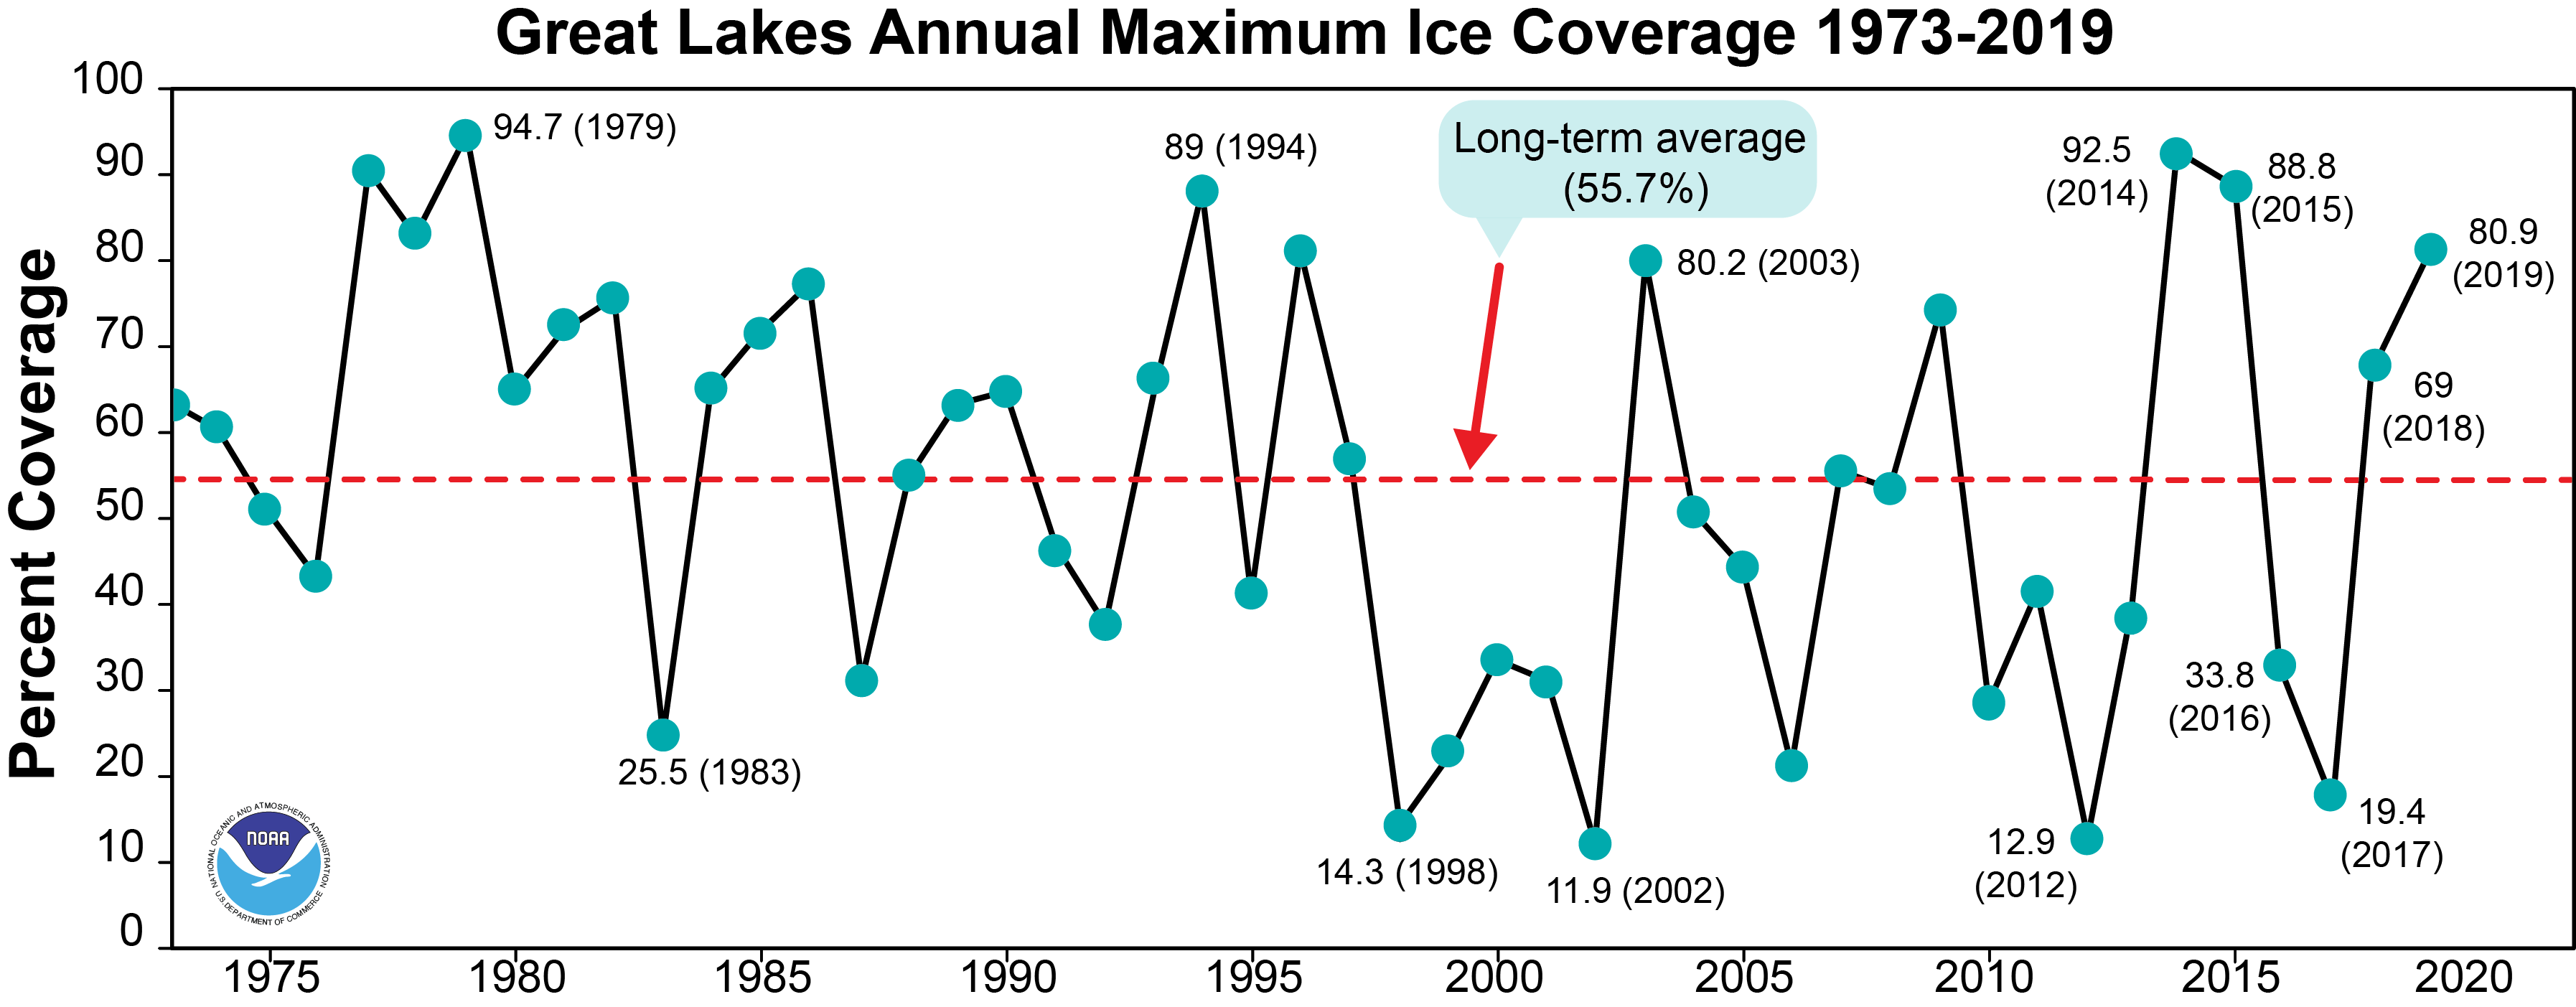
Below is a graph that shows the annual average ice cover on the Great Lakes from 1973 through 2019. In any given year, the ice cover across the lakes varies greatly and as noted above, is directly related to the surface air temperature.
 from 1973 through 2019") |
| Figure 1. Maximum annual average ice cover on the Great Lakes (by percent) from 1973 through 2019. See Figure 6 for details on trends within this period. Image credit: NOAA/GLERL. |
To illustrate the correlation between surface air temperature and ice cover, let’s compare a recent “low ice cover” year—2012, when the maximum ice cover was a mere 12.9%—with a “high ice cover year”, 2014, when ice cover went as high as 92.5%. In Figure 2 below, the map on the left of each image shows how much colder or warmer than normal the air temperature was for the winter season December 1 through March 1. On the right of each image is the corresponding maximum ice cover on the Great Lakes. As you can see, the warmer year resulted in meager ice cover, whereas the colder year saw significantly more.
 |
| Figure 2. Examples of warm and cold winters and the relationship to ice cover. The surface air temperature anomaly (left) and annual maximum ice cover (right) over the period December 1- March 1 for 2011-12 (top) and 2013-14 (bottom) plainly show the relationship between colder or warmer winters and the subsequent ice cover. Image credit: NOAA/ESRL (left) and NOAA/GLERL (right). |
The Great Lakes ice season typically begins in the shallow, protected bays like Green Bay and Saginaw Bay as we see this year in Figure 1. Below is a chart that shows the average date of first ice on the Great Lakes. As you can see, those protected bays and inlets are the first to see ice cover, sometime in December, while the open waters of deep lakes such as Michigan and Ontario rarely see ice cover. Lake Superior, while the largest and deepest of all the Great Lakes, is so far north into the colder winter air that even its open waters often develop ice cover later into the winter on an annual basis.
 from 1973 to 2002 on the Great Lakes") |
| Figure 3. Average date of first ice (> 80% coverage) from 1973 to 2002 on the Great Lakes. Image credit: NOAA/GLERL. |
As I noted, each lake has its own “personality” when it comes to ice cover. Take a look at the ice image in Figure 4 below, from March 9, 2019. At first glance, it doesn’t make sense that Lake Ontario, just a bit smaller in areal size than Lake Erie and well to the north, would have little ice cover while Lake Erie is completely covered. However, Lake Ontario is a much deeper body of water. In fact, its volume is nearly 3.5 times that of Lake Erie. Lake Ontario has the lowest ratio of surface area exposed to the cold air vs. its volume, so that in any given winter it typically develops less ice cover percentage-wise than any other Great Lake as shown in Figure 5.
 |
| Figure 4. Comparison of ice cover on Lakes Erie and Ontario on March 9, 2019. Notice that even though Lake Erie sits farther south than Lake Ontario, it has much more ice cover. Image credit: NASA Worldview. |
") |
| Figure 5. Biweekly climatology of ice cover on each Great Lake (1973-2017), with January 1 highlighted in red to show how the ice coverage typically grows more rapidly after the first of the year. Image credit: NOAA/GLERL. |
One last note on trends in Great Lakes ice cover: a recent study by NOAA’s Great Lakes Environmental Research Laboratory (GLERL) noted a downward trend since the 1970s in the annual maximum extent of Great Lakes ice cover as shown in Figure 6 below. According to GLERL, “The decreasing maximum ice extent of Great Lakes ice is due to a combination of natural climate influences as well as influences from man-made climate change.” They add: “Teasing out how much of the trend is due to each influence is challenging, however. Buried within that long-term decreasing trend in lake ice are cycles of lower and higher amounts of lake ice that take place over decades. And buried within those cycles are large year-to-year swings. This variability occurs due to the randomness of the weather, but also larger climate patterns like the El Niño–Southern Oscillation (ENSO), North Atlantic Oscillation (NAO), Atlantic Multi-decadal Oscillation (AMO) and Pacific Decadal Oscillation (PDO).”
 |
| Figure 6. Time series of annual maximum ice cover averaged over all of the Great Lakes from 1973 to 2018. Yearly data (light blue), the 5-year running average (dark blue), and the overall trend of the maximum ice coverage (dotted line) show the general decreasing trend since 1973. Image credit: NOAA Climate.gov and GLERL. |
So, what does this winter have to offer? Since the build-up of ice cover on the Great Lakes is directly related to temperature, I have shown below the near-term 6-10 day temperature outlook from NOAA/NCEP, which indicates that temperatures over the lakes are most likely to be near average. The latest 3-month (January-February-March) temperature outlook from NOAA’s Climate Prediction Center suggests a good chance of below normal temperatures for the Great Lakes Region overall, so for those who look forward to such winter hobbies as ice fishing, there is hope. Stay tuned, stay safe and enjoy the winter.
 and Jan.-Mar. 2020 (bottom) for the contiguous United States") |
| Figure 7. Temperature outlooks for the period Jan. 4-9, 2020 (top) and Jan.-Mar. 2020 (bottom) for the contiguous United States. Image credit: NOAA/WPC (top) and NOAA/CPC (bottom). |


