| Above: An artist’s rendition of the horrendous carnage that occurred during the 1889 flood in Johnstown, Pennsylvania, on the Stone Bridge over the Conemaugh River (a railway bridge) after it dammed the flood’s debris flow, which subsequently caught fire. Image credit: Library of Congress, Prints & Photographs Archives. |
I began writing this post on Memorial Day 2019 with the American Red Cross in mind. The ARC has served the U.S. Armed Forces and all American people in need at times of disaster, be it natural or human-produced. Clara Barton founded the ARC in 1881 as an branch of the International Red Cross. It came to prominence eight years later as a result of its aid to the people of Johnstown, Pennsylvania, following the nation’s most catastrophic flash flood, which occurred 130 years ago on May 31, 1889.
The Johnstown flood was, at that time, the deadliest natural disaster to befall the U.S. At least 2,208 perished, and the flood still stands as the second or third deadliest day in U.S. history resulting from a natural calamity. Only the Galveston Hurricane is known to have been deadlier (see postscript at bottom).
Herein is a mostly weather-related summary of this historic and tragic event.
Weather synopsis
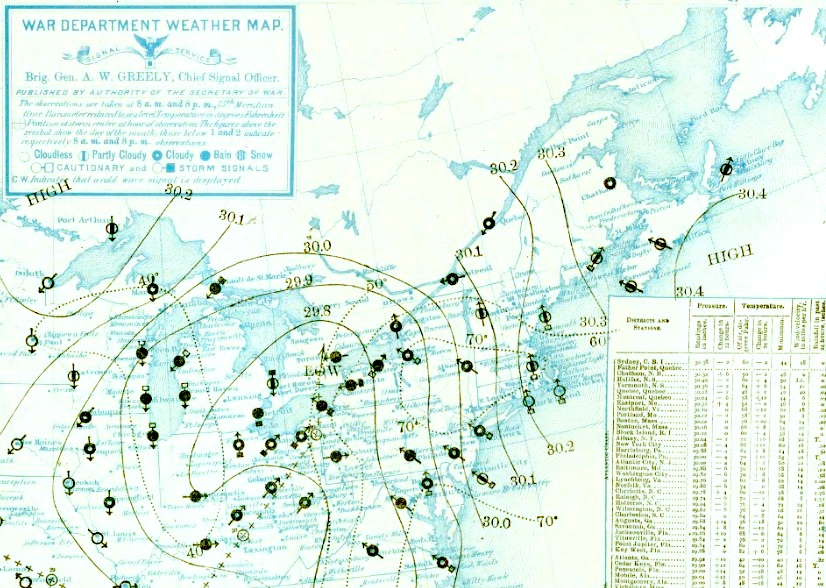
The last few days of May 1889 saw an unseasonably strong surface low-pressure system move from the Southern Plains into the Ohio Valley. By the morning of May 30, the storm was centered over northern Kentucky with a central pressure of about 1000 mb (29.53”). Warm and very moist air was being advected into the eastern U.S., especially over the mid-Atlantic states. An unusually cold air mass stretched over the Great Lakes region with morning temperatures in the 30°s (Fahrenheit) as far south as central Indiana while temperatures were in the 60°s in eastern Ohio and western Pennsylvania.
A shield of very heavy rain extended from the central Gulf Coast north through Michigan and west to Indiana. 24-hour rainfall reports for the period ending at 8 am on May 30 included 2.20” in Nashville, 2.96” in Louisville, 1.98” in Toledo, and 2.12” in Detroit. It is interesting to note that the daily minimum temperatures at both Detroit and Toledo were a frigid 36° when the heavy precipitation was falling.
 |
| Figure 1. Daily weather map for 8 am May 30, 1889, the day before the big flood in Johnstown. A strong surface low pressure of around 1000 mb is centered over Kentucky at this hour and heavy rain is falling from Michigan to the Gulf Coast (probably from thunderstorm activity). There is a sharp temperature difference ahead of the low (in the 70°s) to behind the low (in the 30°s). Image credit: NOAA Central Library: Daily Weather Maps. |
By 8 am on May 31 the low had weakened after traversing Ohio and was centered over southern Ontario, with a secondary low beginning to form in the lee of the Appalachians over Virginia. Very heavy rain had begun falling over western and central Pennsylvania, with Pittsburgh picking up 1.44” in the 24 hours through 8 am on the 31st. Detroit added another 1.04”, bringing their two-day total to 3.16”. The temperature gradient remained pronounced, with 8 am temperatures ranging from the 70s in eastern Pennsylvania to the 40s in Ohio.
 |
| Figure 2. Daily weather map for 8 am May 31, 1889, the day of the great Johnstown Flood of 1889. A secondary low began to form over western Virginia, slowing the advance of the cold front and reinforcing the moisture flow over Pennsylvania during the course of the day. Image credit: NOAA Central Library: Daily Weather Maps. |
A day later, on the morning of June 1, the secondary low was centered over central Pennsylvania. Most of the dynamics causing the heavy rainfall were weakening. Extreme 24-hour rainfall amounts ending at 8 am June 1 included 7.46” in Harrisburg, PA; 3.10” in Washington, DC; and 2.28” in Baltimore, MD, all of which experienced extensive flooding. Interestingly, the rainfall was much lighter east of Harrisburg, with Philadelphia reporting only .42” and New York City .08”, because of a blocking high-pressure system over the Northeast.
 |
| Figure 3. Daily weather map for 8 am June 1, 1889. The secondary low has stalled over central Pennsylvania and a strong surface high centered over Nova Scotia has blocked the progression eastward of the storm system, forcing it to fill and weaken. Image credit: NOAA Central Library: Daily Weather Maps. |
The rainfall in Johnstown’s vicinity
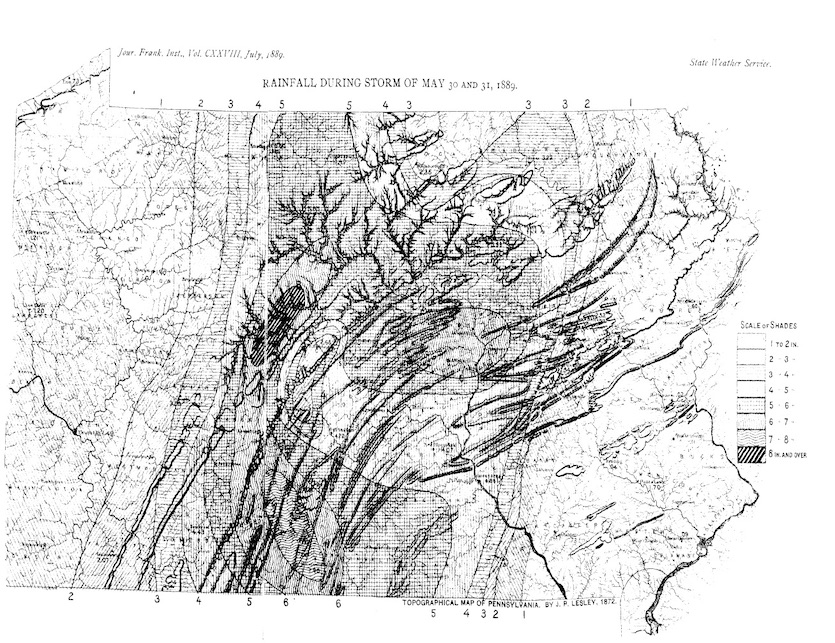
The official Monthly Weather Review for May 1889, published by the Pennsylvania State Weather Service and prepared by the Franklin Institute in Philadelphia, provided the following precipitation statistics for the portion of central Pennsylvania impacted by the storm. Below is a list of official storm reports for various periods of time between the afternoon of May 30 and midnight May 31-June 1, together with each observing site’s distance from Johnstown:
Grampian Hills (near Williamsport, 80 miles NE of Johnstown): 8.37”, six inches of which fell in one seven-hour period during the morning of May 31.
McConnellsburg (50 mi SE): 8.31”
Harrisburg (100 mi E): 7.56”
Charlesville (20 mi SE): 6.71”
Selinsgrove (100 mi E): 6.71”
Huntingdon (50 mi NE): 6.57”
Emporium (85 mi NE): 5.85”
Holidaysburg (25 mi E): 5.51”
Smethport (100 mi N): 5.50”
Coudersport (100 mi NE): 5.40”
The rainfall gradient fell off markedly to the west, with Pittsburgh (60 miles west of Johnstown) picking up only 1.49” during this time period.
 |
| Figure 4. Isohyetal map (a map with contours at various rainfall amounts) for Pennsylvania during the storm of May 30-31, 1889. It is estimated that a 12,000 sq. mile area of central Pennsylvania received 6-8” of rain during the storm. Image credit: Monthly Weather Review, Pennsylvania State Weather Service. |
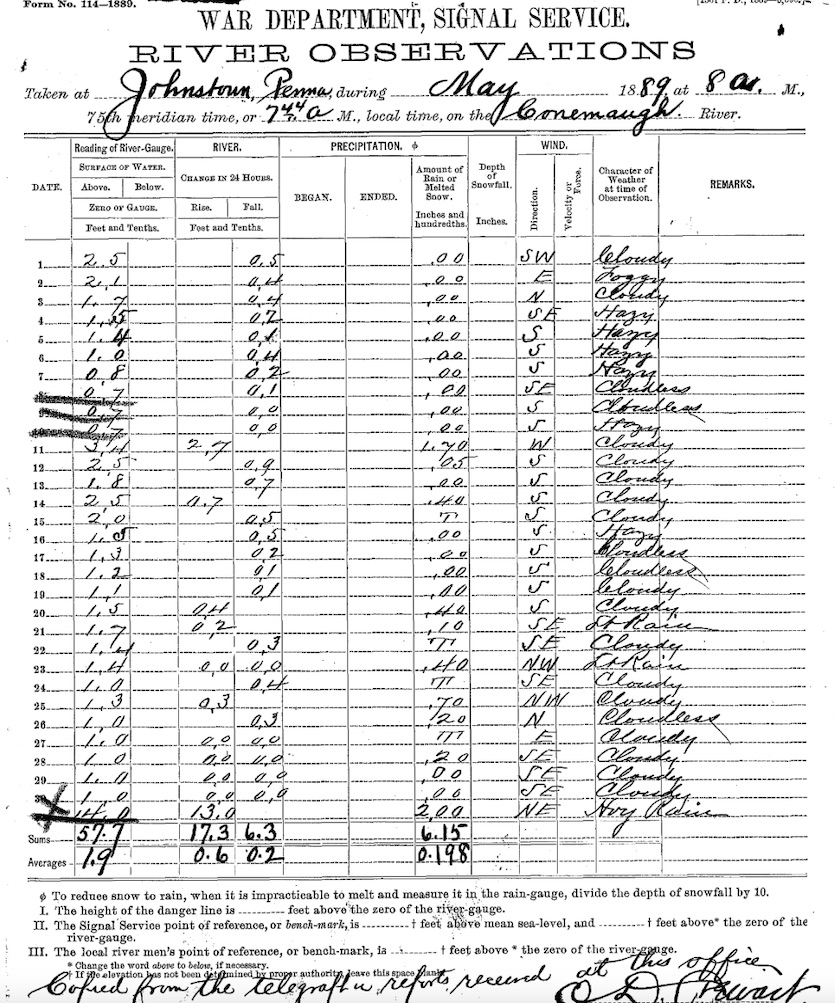
The official weather and river observer for Johnstown telegraphed that 2.00” of rain had fallen in town as of 8 am May 31. Sadly, he perished in the flood and the rain gauge was swept away, so we will never know just how much rain fell in Johnstown during the storm. Meteorological observations were not resumed in Johnstown until December 1889.
 |
| Figure 5. The Conemaugh River reports and precipitation for the month of May 1889. The form was copied from telegraph reports submitted each day at 8 am. The observer and the station site were swept away by the flood after the daily report for May 31 was submitted. Image credit: War Department, Signal Service, 1889. |
The dam and the flood
The South Fork Dam was originally constructed in 1853 as a means to feed water during dry periods into the Pennsylvania Canal, which was a critical means of transport traversing Pennsylvania at the time. The dam was one of the largest earth and rock fill embankments in the entire U.S. when completed, standing 72’ high, 931’ long and 272’ thick at its base. The reservoir that formed behind it was also one of the largest man-made lakes in the U.S. at the time, being about 1.5 by 2.5 miles in diameter and up to 70’ deep.
 |
| Figure 6. Map of the Johnstown region showing the principal locations and players in the events of May 31, 1889. Image credit: Courtesy Steven Ward. |
 |
| Figure 7. A schematic of the original South Fork Dam above Johnstown, PA, as it was constructed between 1840 and 1853. Image credit: Walter Smoter Frank, “The Cause of the Johnstown Flood”. |
All this loomed at an elevation 450’ higher and just 15 miles distant from the booming industrial city of Johnstown and its 30,000 residents. The dam took 13 years to complete, but by the time it was finished the Pennsylvania Railroad had pushed its way over the Alleghenys and the canal became redundant, as did the dam. It was sold by the state to an entrepreneur named Benjamin F. Ruff for $2000 in 1879. Ruff developed the property as an exclusive summer retreat with numerous cottages and a large clubhouse that he promoted to the elite of Pittsburgh. Membership of the now-named South Fork Fishing and Hunting Club was limited to 100 members and their families. The members included some of the nation’s industrial titans, such as Andrew Carnegie, Andrew Mellon, Henry Clay Frick, and Philander C. Knox.
The managers of the new club eventually discovered that floods since the dam’s original construction had damaged parts of the structure and the stone culverts at its base, which regulated the reservoir’s outflow. As a cost-saving measure, they patched it up with mud, hemlock pilings, and straw. The culverts were removed and the outlets filled in leaving only a spillway to release pressure when the reservoir became full. Another critical change made was lowering the height of the dam by two to three feet in order to make it wide enough (20’) for carriages to cross.
 |
| Figure 8. Schematic of the dam following its “renovation” by the South Fork Fishing and Hunting Club in 1880. Image credit: Walter Smoter Frank, “The Cause of the Johnstown Flood”. |
On the morning of May 31, 1889, the club president, Colonel E. J. Unger, observed that the torrential rainfall and attendant rise in the reservoir was placing the dam in imminent danger of collapse. A crew of 30, who had been working on the grounds of the club, attempted to stem the overflow but with no success. The dam collapsed around 3:15 pm that afternoon. A wall of water, at times 40’ tall, and flowing at the rate of 420,000 cubic feet per second (equivalent to the average flow of the Mississippi River at its delta) rushed down the Little Conemaugh River Valley and overwhelmed the city of Johnstown at 4:10 pm. It only took 45 minutes for the reservoir to empty.
 |
| Figure 9. The John Shultz house on Union Street in Johnstown was one of the thousands destroyed in the 1889 flood. Mr. Shultz and five other people were in the house when it was lifted off its foundations and floated through town before capsizing. Incredibly, all six occupants survived. Image credit: Carnegie Library of Pittsburgh. |
The wall of debris-choked water surged through the city, swallowing everything in its path, until it came up against a large stone railway bridge that passed 32 feet above the Conemaugh River. Amazingly, the bridge withstood the heaving mass of debris and water. Many of the flood survivors, some of whom had ridden the crest of the flow, were able to take refuge on the bridge. Unfortunately, overturned oil tanks were ignited by coal embers and set the debris on fire, killing hundreds more in the ensuing inferno. All in all, 2,208 known lives were lost and another 979 were left missing in Johnstown and other towns in the area.
The video below is of a physics-based simulation of the 1889 Johnstown dam break and flood produced by geophysicist Steven Ward (University of California, Santa Cruz). The simulation includes timing, water volumes, flood depths and flow speeds that can be compared with historical reports of the day's events.
For more details about this event and its victims, heroes, and villains, you can do no better than world-renowned historian and author David McCullough’s account of the event (and his first book), The Johnstown Flood (1968).
 |
| Figure 10. A photograph of downtown Johnstown, Pennsylvania following the flood of May 31, 1889. The image is titled “Ruins from Site of the Hulburt House.” This photograph was sold 12 years later as being an image of the devastation to Galveston, Texas, following the hurricane of September 1900 (the hill in the background was erased). It has been widely credited (including by myself!) as being of such. Image credit: NOAA Photo Library. |
The aftermath
In a post-mortem study of the event, civil engineers attributed the dam failure to insufficient freeboard and spillway capacity. The depth of the water in the spillway was about 7.5 feet and its discharge capacity only about 4,000 cubic feet per second if the spillway was clear of debris, which it wasn’t on the morning of May 31. They determined that this level of discharge capacity was not capable of withstanding a once in twenty-year rainfall event over the 50 square-mile drainage area above the dam. The disaster led to the adoption of more stringent safety codes for the construction of similar impounding dams.
Another legacy of the disaster was the eventual adoption nationwide of a legal “strict liability” code in criminal and civil law, meaning a person can be held responsible for the consequences of an activity even in the absence of fault or criminal intent. This code was in response to the fact that no survivors were able to recover any damages in court from the South Fork Fishing and Hunting Club nor from its members, as the club was set up as a LLC (limited liability company) that protected the personal assets of the club members.
Perhaps the most significant legacy of the flood came from the relief effort provided by Clara Barton and the American Red Cross, who arrived on the scene just five days after the event and stayed until the following October. Extensive national and international media coverage of the flood’s aftermath focused on the heroic efforts of Barton and her ARC associates, who distributed supplies valued at $211,000 (about $6 million in 2019 dollars) that directly benefited some 25,000 of the area residents. This brought the organization into national prominence, ultimately resulting in the ARC becoming the nation’s premier non-governmental disaster relief agency.
Sadly, the 1889 flood would not be Johnstown's last. Snowmelt and heavy rain led to regional flooding on March 17, 1936, that brought floodwaters as high as 14 feet, killing about two dozen people in the Johnstown area and damaging thousands of buildings. Johnstown then experienced another deadly flood on July 19-20, 1977, when localized but intense nighttime thunderstorms dumped close to 12” of rain in the area. Flood control measures implemented after the 1936 flood proved inadequate for this downpour, and six dams failed, sending up to 6’ of water across two-thirds of the city in what was deemed a 500-year flood by the U.S. Army Corps of Engineers. A total of 84 people were killed.
Postscript: What have been the deadliest days in U.S. history?
Below is what the preponderance of current evidence suggests are the deadliest days in U.S. history produced by either a natural or human-caused calamity. (The list does not include pandemics such as the influenza outbreak of 1918, when thousands died every day for months on end.) All round-number totals are estimates. As many as 12,000 people on Galveston Island were killed or injured, as cited by John Edwards Weems, author of A Weekend in September.
1. 6,000-8,000
Galveston, Texas • September 8, 1900
Hurricane/storm surge
2. 4,000
Sharpsburg, Maryland • September 17, 1862
Battle of Antietam, Civil War
3. 3,000
San Francisco • April 16, 1906
Earthquake and fire
4. 2,996
New York City, Washington, Pennsylvania • September 11, 2001
Terrorist attack
5. 2,500
Florida • September 17, 1928
Hurricane
6. 2,403
Pearl Harbor, Hawaii • December 7, 1941
Military attack
7. 2,208 (plus 979 reported missing)
Johnstown, Pennsylvania and nearby towns • May 31, 1889.
Flood and dam collapse
It seems that September is a particularly dangerous month for the U.S., partially as a result of that being the peak of the hurricane season.
Christopher C. Burt
Weather Historian


