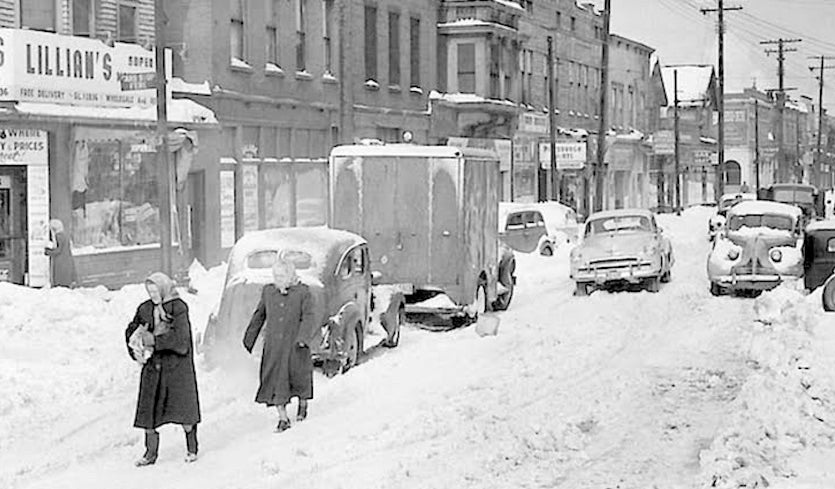
| Above: A snowbound scene in Cleveland, Ohio, during the great storm of November 1950. Cleveland picked up more than 20" of snow, with temperatures dropping below 0°F. Image credit: Cleveland News/Richard J. Misch via NOAA/NCEI. |
In my previous two posts (published October 20 and November 5), I delved into some of the most anomalous weather events in U.S. history. Not included in my list were any examples of anomalous extratropical (non-tropical) storms. In this post I focus on one of the most extreme of such, which occurred almost 70 years ago during the post-Thanksgiving weekend of Friday-Monday, November 24-27, 1950. Known as the Great Appalachian Storm, it ranks as one of the most extreme, costliest, and anomalous extratropical storms in U.S. history.
Eminent meteorologists Paul Kocin and Louis Uccellini stated in their classic book Northeast Snowstorms: “Although this is not a traditional ‘Northeast snowstorm’, since the heaviest snows fell far west of the Northeast coastline, it is included here [in our book] because it represents perhaps the greatest combination of extreme atmospheric elements ever seen in the eastern United States. We feel that this storm is the benchmark against which all other major storms of the 20th century could be compared.”
Even the normally staid USWB Climatological Data publication for Pennsylvania minced no words in the opening paragraph of its report on the storm: “The elements on November 24-25, 1950 affected more people in more diverse and violent ways than at any previous time in Pennsylvania history.”
The synoptic pattern
One of the interesting features of this storm was how tightly wound up the atmosphere became, both at the surface and upper levels, as the storm intensified along the Appalachian spine.
 between 10 pm ET on November 23, 1950, and noon ET November 26") |
| Figure 1. Progression of the 500-mb heights (about four miles above the surface) and 400-mb winds between 10 pm ET on November 23, 1950, and 10 am ET November 26. The configuration of the upper-level low caused warm air to wrap around the surface low and cold air to flow in south of the low, resulting in some crazy surface temperature gradients. Image credit: From Northeast Snowstorms Vol. 2, (AMS Books), p. 351, courtesy of Paul Kocin and Louis Uccellini. |
At one point (2:30 pm ET on November 25) the temperature in Pittsburgh was 9°F with blizzard conditions while in Buffalo, 150 miles to the north, it was 54°F with heavy rain showers and hurricane-force wind gusts. In Buffalo, the cold air was actually coming from the southwest. Figure 2 shows what the surface map looked like at around that time.
|
| Figure 2. Surface conditions at 1:30 am ET on November 24, 25, 26, and 27, 1950 (top to bottom). Note the double-barreled low over Pennsylvania with one 988-mb center located over the southeast corner of the state and another 988-mb center of the northwest corner of the state, while an equally anomalous high pressure system with a central pressure of 1050 mb sits over Labrador in Canada. Image credit: NOAA Central Library, Daily Weather Maps. |


The storm made an unusual track westward once the two surface lows congealed into one in eastern Ohio late on the 25th. By midnight, the center had intensified to its lowest pressure of 978 mb, while a surface high over eastern Canada had intensified to 1050 mb. (In fact, Dayton, Ohio, set its November record low pressure of 984mb/29.06” while Caribou, Maine, set its November high pressure record of 1042mb/30.77” in the same 24-hour period.) This extreme pressure gradient, of course, is why the winds in New England reached such an historic intensity.
On the 26th, the low slowly drifted westward while weakening and filling in. This resulted in the very unusual occurrence of a major snowstorm tracking west across the eastern U.S. Indianapolis had clear skies with a temperature of -1° early in the morning of November 25. As the day progressed, clouds thickened from the east and snow began falling heavily late in the day, with a 7” accumulation by November 26.
 |
| Figures 3, 4, 5, and 6. Surface maps for 1:30 am ET on November 24, 25, 26, and 27. Note the heavy snow with quarter-mile visibility in Nashville in the November 24 map, and then the amazing temperature gradient occurring in the November 25 map: while it was 9° with blizzard conditions at Roanoke, Virginia, it was 57° with rain showers in Richmond, just 100 or so miles to the east. Image credit: NOAA Central Library, Daily Weather Maps. |
An in-depth report on the storm’s synoptic evolution can be found in the November 1950 issue of Monthly Weather Review.
Stunning snowfall
NCEI (the National Centers for Environmental Information) rates this event a 34.7 on its RSI (Regional Snowfall Index) for the Ohio Valley, which is by far the highest value for any storm (out of 212 rated) in the history of the region.
 |
| Figure 7. Pittsburgh, Pennsylvania, was buried under 30” of snow, making the storm the city’s single greatest snow producer on record. Image credit: Photo by Walter Stein, Carnegie Library Collection. |
Some of the snowfall records from the storm that still stand today include:
— West Virginia’s state single-snowstorm record: 63.2” at Coburn Creek on November 23-29 (the USWB Climatological Data for West Virginia says the greatest storm total was 67.5” at Pickens No.1 site).
—Ohio’s state single-snowstorm record: 44.0” at Steubenville on November 24-28 ,of which 36.3” accumulated in three days. (Some lake effect storms near the shores of Lake Erie have reported greater unofficial totals in more recent years).
—Pittsburgh’s greatest single snowfall: 30.2” on Nov. 23-29, of which 27.4” fell in three days (November 24-27) and 22.1” in 24 hours (November 24-25). The latter was surpassed only by 23.8” during the March 1993 ”Storm of the Century”.
—Youngstown, Ohio, 24-hour snowfall record: 20.7” on November 24-25 (also the state record for such until 22.0” fell in Bellefontaine on December 22-23, 2004). Youngstown also set a single-storm record of 28.7” on November 24-27.
—Charleston, West Virginia, single-storm record: 25.6” on November 24-25.
—Elkins, West Virginia, 24-hour snowfall record: 20.7” on November 24-25. Elkins also set a single-storm record of 29.5” on November 24-25.
—Parkersburg, West Virginia, single-storm record: 34.4” on November 24-29.
—Toronto, Canada, calendar-day record for November: 12” on November 24.
One of the storm’s classic stories involved the Big Ten football championship between Michigan and Ohio State that was scheduled to take place in Columbus, Ohio, on Saturday, November 25. Fifty thousand spectators (of the 82,000 tickets sold) watched the kickoff in heavy snow, 40-mph winds, and a temperature of 5°. The Snow Bowl or Blizzard Bowl, as it came to be known, saw Michigan prevail 9-3 even though they didn’t achieve a single first down and only progressed 27 yards. There were 45 punts in the 60 minutes of playing time.
 |
| Figure 8. Map of snowfall totals for the November 22-28, 1950 storm. Colored shading represents 10-inch increments. Image credit: From Northeast Snowstorms Vol. 2 (AMS Books), p. 351, courtesy of Paul Kocin and Louis Uccellini. |
Wild wind
East of the snow area, winds up to hurricane force were observed in some areas. Top wind gusts included:
110 mph in Concord, New Hampshire
108 mph at Newark Metropolitan Airport (now Newark Liberty International Airport)
100 mph in Hartford, Connecticut, with 70 mph sustained (highest on record)
94 mph at New York International Airport (now John F. Kennedy International Airport)
90 mph in Syracuse, New York
88 mph in Allentown, Pennsylvania
88 mph in Bridgeport, Connecticut
72 mph in Burlington, Vermont
All of the above were all-time records for each site. Sustained winds of 80 mph were measured at the Boston airport (now Logan International Airport) on November 26. Perennially windy Mt. Washington, New Hampshire, reported wind gusts to 160 mph. LaGuardia Airport in New York City was swamped by floodwater blown in by the ferocious winds across Long Island Sound.
 |
| Figure 9. The tarmac at LaGuardia Airport in New York City was swamped by water blown in from Long Island Sound. Note the two planes in the background with their tails in the water! Image credit: New York Office of Emergency Management. |
Crushing cold
All-time November record low temperatures were achieved at many sites before, during, and after the main storm event. These include:
-23° in Pellston, Michigan (a state record as well)
-5° in Asheville, North Carolina
-1° in Nashville, Tennessee
-1° in Louisville, Kentucky
-2° in Chicago, Illinois (earliest sub-zero weather on record)
3° in Atlanta (crushing its November low at that time of 14° by an astonishing 11°!)
A curious extreme occurred in Virginia: the state’s monthly high in November 1950 of 90° at Buccs Island Dam on the 2nd and low of -3° at Burkes Garden on the 25th were respectively the hottest and coldest temperatures ever measured during November in Virginia.
Several all-time state monthly record lows (all of them still standing) were set well south of the most intense snowfall. These include:
-1° in Caesars Head, South Carolina
-8° in Allardt, South Carolina
0° at Blairesville Experiment Station, Georgia
0° at Mount Magazine, Arkansas
2° in Booneville, Mississippi
Rain records
Record rainfall amounts fell in parts of eastern Pennsylvania. Pottsville measured 6.86” of precipitation in 24 hours on the 24th and 25th, and Reading picked up 6.06” on the 25th (3.29” of which fell in just 4-5 hours). Though since surpassed, all of these were all-time records for any date at the time. In New York, 7.78” fell in one day on Slide Mountain on the 26th and Pinkham Notch, New Hampshire observed 6.04” in one day on the 26th, the largest total measured during the storm in New England.
Flooding was extreme in eastern Pennsylvania, with the Schuylkill River at Fairmont Dam reaching its highest level since 1902.
Damage costs, fatalities, and forecasts
Somewhere between 160 and 353 people perished in the storm (depending on source). The insured damage costs reached $66.7 million in 1950 dollars, or about $680 million in 2018 dollars. This was the costliest storm of any kind (including hurricanes) for U.S. insurance companies at the time.
One positive side to the storm was that it was used as a test case for the nascent use of weather modeling of the atmosphere. The first numerical weather model forecast was carried out just months before the November 1950 event. “This storm became a popular case study, because it brought unusually severe weather and had not been well predicted in real time,” noted Peter Lynch in a review of the first numerical weather forecasts (see the January 2008 issue of the Bulletin of the American Meteorological Society).
Interestingly, a group of researchers led by NOAA’s Robert Kistler carried out a retroactive forecast of the 1950 storm in 2000 and found evidence that “this historic storm was actually quite predictable.” As reported in the February 2001 issue of BAMS, “The rather high predictability of this historic storm is confirmed by the fact that all forecasts with lead times from 4.5 days to 1 day verifying on the same day show good agreement in its prediction.” One can only imagine the hype a storm as extreme as this one would generate if it were to arrive today with four days of advance notice!
Christopher C. Burt
Weather Historian


