| Above: Tropical Storm Gordon as seen at 10:45 am EDT September 4, 2018. Image credit: NOAA/RAMMB. |
Hurricane warnings and storm surge warnings are flying for portions of the U.S. Gulf Coast from Southeast Louisiana to Alabama as Tropical Storm Gordon speeds northwestward at 15 mph, towards an early Wednesday morning landfall. Two hurricane hunter aircraft were in the storm on Tuesday morning, and found that Gordon was holding nearly steady in strength, with a central pressure near 1001 mb and top sustained winds just below Category 1 hurricane strength, at 65 mph.
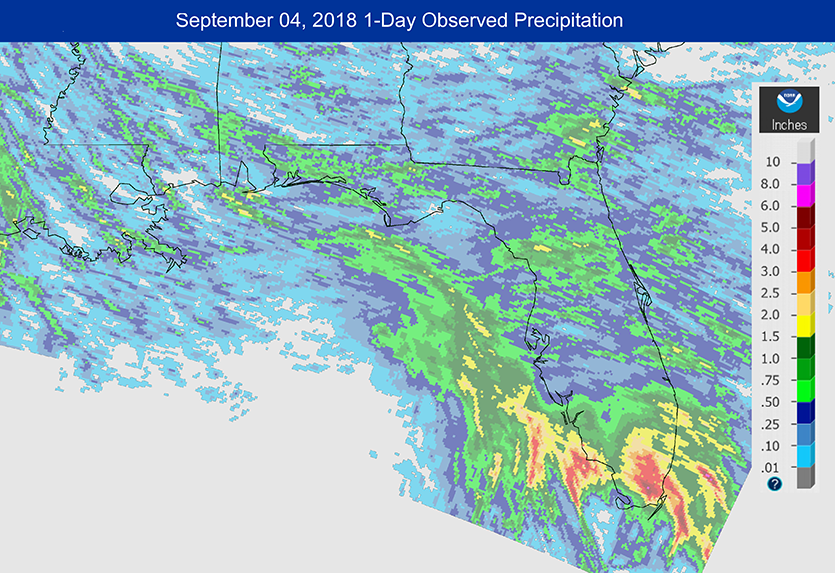 |
| Figure 1. Observed rainfall amounts over the Southeast U.S. for the 24 hours ending at 8 am EDT Tuesday, September 4, 2018. Gordon dumped up to 6” of rain over South Florida. Image credit: NOAA/NWS. |
Gordon is a relatively small storm, with tropical storm-force winds that extend out 80 miles from the center. This small size is making the storm vulnerable to wind shear. An upper level trough of low pressure to the west of Gordon is bringing strong northwesterly winds to the storm, creating a moderate 15 – 20 knots of wind shear. Satellite imagery over the past day has shown that Gordon has struggled to grow more organized in the face of this wind shear, with a clumpy appearance to its heavy thunderstorms. Near dawn on Tuesday morning, the shear had exposed the low-level center of Gordon to view, with the heavy thunderstorms confined to the east side of the storm. By late Tuesday morning, though, the storm had managed to cover up its center, and appeared to be growing more organized.
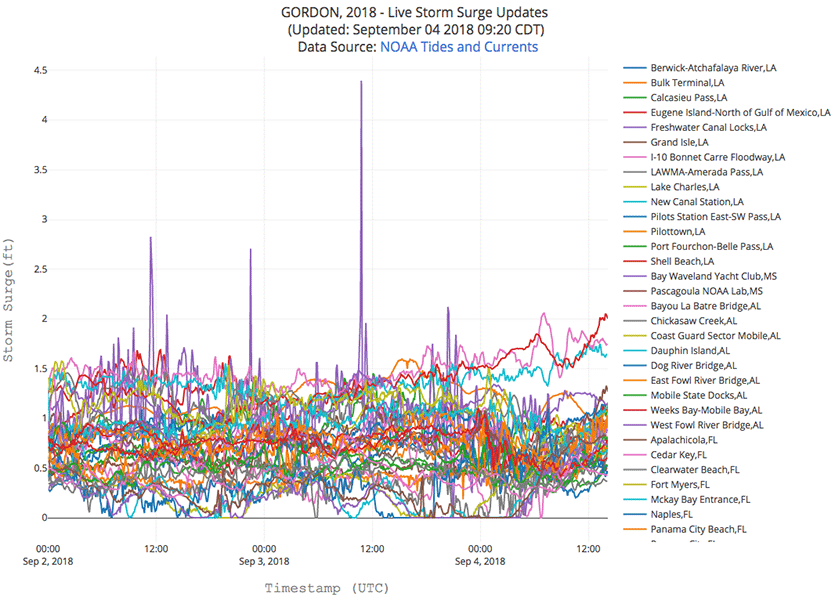 |
| Figure 2. Louisiana State’s storm surge update page for Gordon, showing the highest storm surge of just over two feet was at Shell Beach, Louisiana, as of 10:30 am EDT Tuesday, September 4, 2018. |
Gordon’s impacts
Gordon has been a heavy rainmaker over South Florida, where 24-hour rainfall amounts of up to 6” have been observed, and radar data from the Gulf Coast showed heavy rains from Gordon began to affect the Florida Panhandle coast late on Tuesday morning.
NOAA Buoy 42039, located north of Gordon's center, reported a sustained wind of 43 mph (69 km/h) and a gust to 49 mph (80 km/h) late Tuesday morning, and easterly winds over the northern Gulf of Mexico in advance of Gordon were already causing a rise in water levels of 1 – 2 feet above normal along the coasts of Mississippi and Southeast Louisiana at 11 am EDT Tuesday, as seen using our wundermap with the Storm Surge layer turned, NOAA’s Quicklook page for tide levels, or Louisiana State’s storm surge update page. The highest storm surge of just over two feet was at Shell Beach, Louisiana.
Forecast for Gordon
The track forecast for Gordon remains very solid, but there is still some uncertainty over just how strong Gordon will be when it reaches the Gulf Coast on Tuesday night. The 06Z runs of the high-resolution HWRF and HMON models show some modest strengthening today, with both models predicting that Gordon would make landfall as a high-end tropical storm or low-end Category 1 hurricane somewhere on the Mississippi or west Alabama coast between 6 and 10 pm EDT Tuesday. The official NHC forecast from 11 am EDT Tuesday is in line with these projections, as it shows Gordon making landfall as a minimal hurricane on Tuesday night after 8 pm EDT on the Mississippi coast.
Because Gordon’s core is relatively small, the storm has the ability to weaken or strengthen quickly. Given that Gordon’s convection was strengthening on Tuesday morning, the storm could intensify a bit more than predicted within the Category 1 range before it makes landfall. Any hurricane-force winds at landfall would be confined to a small area near the coast just east of Gordon’s center.
Storm surge with Gordon may be lower than recent storms of comparable strength, because of Gordon’s relatively small and disorganized state and its brief time over water, but residents should be prepared for the possibility of inundations above ground level at high tide in this range:
1 to 2 feet: Louisiana-Texas border to the mouth of the Mississippi River
2 to 4 feet: Mouth of the Mississippi River to Shell Beach, LA
3 to 5 feet: Shell Beach, LA, to Dauphin Island, AL
2 to 4 feet: Dauphin Island, AL, to Navarre, FL, including Mobile Bay
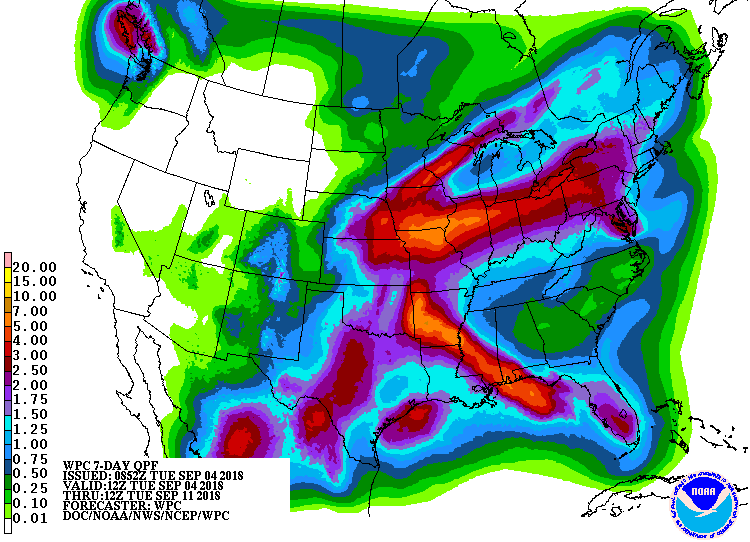 |
| Figure 3. Rainfall outlook for the seven-day period from 8 am EDT Tuesday, September 4, 2018, to Tuesday, September 11. Image credit: NOAA/NWS/WPC. |
Rainfall will be Gordon’s biggest threat—from the Gulf Coast to the Midwest
Gordon may be one of those tropical cyclones whose impact days after landfall is greater than during landfall. Gordon is expected to dump widespread 4” – 8” rains along a swath roughly 50 – 100 miles wide from the Mississippi/Alabama coast to the Arkansas/Mississippi border. Totals near the coast could exceed 12”, and similar amounts could occur over or near Arkansas by Thursday or Friday. At that point, moisture from Gordon will be sweeping northward into the Midwest, which has been hard hit by multiple heavy rain and flood events over the last several weeks. Models suggest that Gordon’s remnants could dump very heavy rains on Friday and Saturday along a convergence zone expected to lie from northern Missouri to northern Ohio, and eventually into upstate New York. The exact placement of this band could shift north or south as the situation unfolds. In short, significant flood impacts from Gordon and its remnants will be a possibility throughout the week ahead.
 |
| Figure 4: Hurricane Florence as seen at 11:50 am Tuesday, September 4, 2018. Image credit: Levi Cowan, tropicaltidbits.com. |
Florence becomes a hurricane; no threat to land this week
Tropical Storm Florence intensified into a Category 1 hurricane with 75 mph winds at 11 am EDT Tuesday, becoming the third Atlantic hurricane of 2018. Florence was headed west-northwest at 12 mph into the Central Atlantic on Tuesday morning, and poses no threat to any land areas this week. Conditions were marginal for development on Tuesday morning, with sea surface temperatures (SSTs) a cool 26.5°C (80°F) and the storm in a region where the dry air of the Saharan Air Layer (SAL) was creating a mid-level relative humidity of 50 – 55%. Moderate wind shear of 10 – 20 knots was keeping intensification slow. Satellite images showed a well-organized system, but with no obvious eye.
The intensity forecast for Florence shows conflicting influences. The atmosphere surrounding Florence will remain dry this week, with a mid-level relative humidity of 50 – 55%. With the storm expected to experience moderately high wind shear of 15 – 20 knots during much of this period, slow weakening is indicated. However, Florence will experience slowly increasing SSTs this week, reaching 29°C (84°F) by Saturday. This will tend to favor strengthening. Overall, the NHC forecast of slow weakening followed by slow strengthening this week appears the best bet.
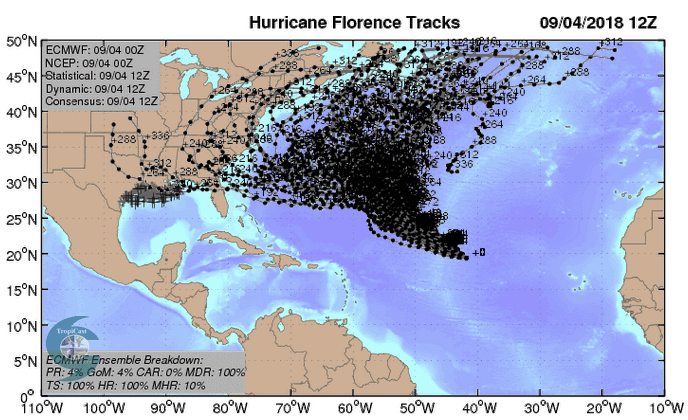 |
| Figure 5: Predicted tracks for Florence from the 50 members of the 0Z Tuesday run of the European ensemble forecast. Most of these forecasts predicted that Florence would recurve out to sea without affecting any land areas, though about 20% of the tracks intersected the U.S. East Coast late next week. Image credit: CFAN. |
Steering currents favor a west-northwesterly to northwesterly track for the rest of the week, which will take Florence through the Central Atlantic, far from land. This weekend, though, Florence will have a major choice to make. If the storm is relatively strong—at Category 1 hurricane strength or stronger--Florence will most likely recurve to the north, well east of Bermuda, in response to a strong upper-level trough of low pressure passing to the north. This is the solution of the 0Z Tuesday run of the European model. However, if Florence weakens, the storm will tend to be steered by the atmospheric flow at lower levels of the atmosphere, which favors a more west-northwesterly track. In this scenario, endorsed by the 0Z Tuesday run of the UKMET model, Florence would avoid recurvature, and get trapped to the south of strong ridge of high pressure. Florence would continue moving to the west-northwest, posing a threat to Bermuda on September 10 - 11, and to the U.S. East Coast later next week. The 0Z and 6Z runs of the GFS model were between these two extremes. The steering currents so far in advance are difficult to accurately predict, though, and will likely depend upon the very uncertain interaction of Typhoon Jebi in the Western Pacific with the large-scale atmospheric circulation late this week. So, stay tuned, and root for Florence to grow strong now, increasing its odds of recurvature.
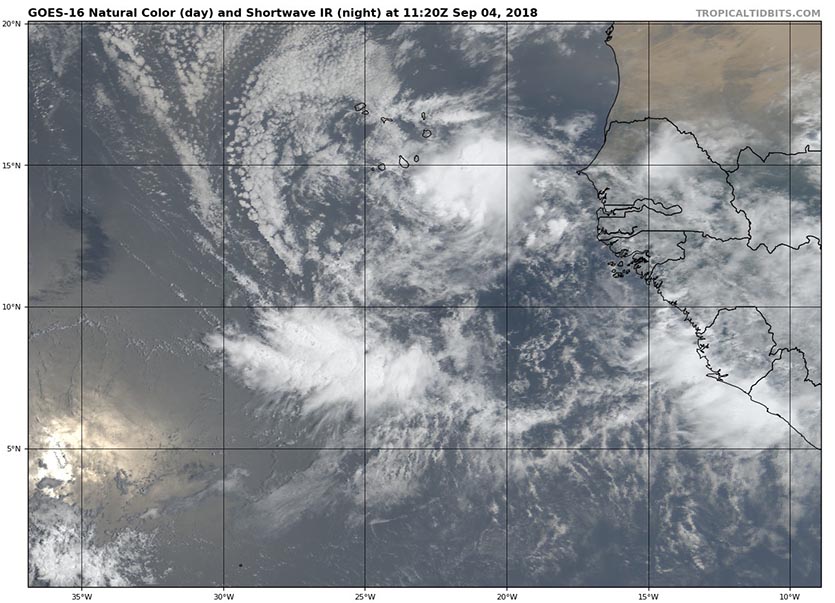 |
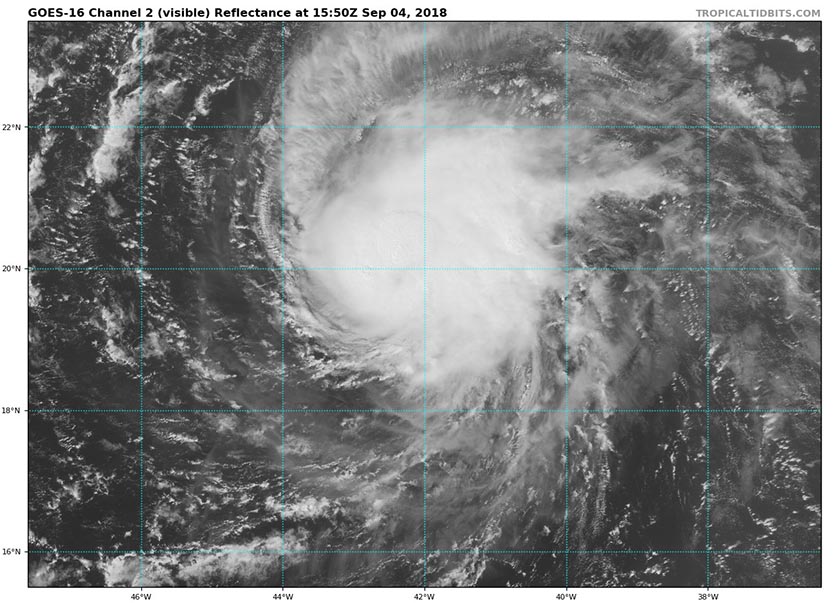
| Figure 6. Visible satellite image of tropical wave 92L off the coast of Africa on at 7:20 am EDT September 4, 2018. Image credit: Levi Cowan, tropicaltidbits.com. |
92L in Eastern Atlantic may develop late this week
A strong tropical wave (92L) that emerged from the coast of Africa on Monday morning was located about 300 miles south-southeast of the Cabo Verde Islands at 8 am EDT Tuesday. This system may be a long-range threat to the Caribbean next week. Favoring development of the wave were warm sea surface temperatures (SSTs) near 29°C (84°F) and a moist atmosphere. However, wind shear was high, 25 - 30 knots, which was limiting development. Satellite images on Tuesday morning showed that the wave had a moderate amount of spin and heavy thunderstorm activity, but it was poorly organized.
The 12Z Tuesday run of the SHIPS model predicted that SSTs would slowly cool and the atmosphere would grow drier along 92L’s path through Friday, limiting the potential for it to develop, even though wind shear was predicted to fall to the moderate range. However, SSTs will begin to warm by Friday and wind shear is predicted to be moderate, which may allow the system to organize into a tropical depression by this weekend. The 0Z Tuesday runs of our top three models for predicting tropical cyclone development—the European, GFS and UKMET models—all showed development of the wave within five days. In their 8 am Tuesday Tropical Weather Outlook, NHC gave the system 2-day and 5-day odds of development of 20% and 70%, respectively. The next name on the list of Atlantic storms is Helene.
Steering currents favor a slow west to west-northwesterly track at about 10 mph over the next week, and the wave could arrive in the Lesser Antilles Islands as early as Wednesday, September 12, as predicted by the European model. However, a threat to the Caribbean is by no means a sure thing, as the GFS and UKMET models show 92L embarking on more of a northwesterly track late this week, which would make it more difficult for the system to threaten the Caribbean islands.
93L coming?
Another tropical wave that is predicted to emerge from the coast of Africa Thursday night or Friday morning has support for development by Sunday from the 0Z Tuesday runs of the European and GFS models, but not the UKMET model. This wave is expected to follow 92L’s slow west to west-northwesterly path, passing a few hundred miles south of the Cabo Verde Islands on Sunday. In their 8 am Tuesday Tropical Weather Outlook, NHC was not yet giving development odds for this system, but it is worthy of assigning 5-day development odds of 10%, given the consistent model forecasts over the past few days.
 |
| Figure 7. Infrared-wavelength image of Hurricane Olivia at 1430Z (10:30 am EDT) Tuesday, September 5, 2018. Image credit: NASA/MSFC Earth Science Branch. |
Norman and Olivia churn harmlessly across Central and Eastern Pacific
Two hurricanes plowing westward between the Hawaiin Islands and Mexico are not expected to affect the islands. Hurricane Norman, once a Category 4 storm, had weakened to Cat 1 strength as of 11 am EDT, with top sustained winds down to 85 mph. Norman was located about 760 miles east of Hilo, heading west at 17 mph. Models agree that a weakness in the steering currents north of Norman will allow it to angle northward over cooler waters by Thursday well before reaching Hawaii.
Much closer to Mexico, the ninth hurricane and fifteenth named storm of this hyperactive East Pacific hurricane—Olivia—was spinning about 630 miles southwest of Cabo San Lucas. Despite moderate to strong wind shear, Olivia vaulted to Category 2 strength early Tuesday, with top sustained winds of 105 mph as of 11 am EDT. Olivia could reach Category 3 strength before reaching cooler waters and gradually weakening later this week, remaining far at sea. In a typical season (based on NHC statistics from 1971-2009), the East Pacific east of 140°W produces only eight hurricanes in all, and the fifteenth named storm occurs on average on November 5. The 2010s have been a busy decade in this region, though. According to Phil Klotzbach (Colorado State University), the only three years since 1995 that have seen the ninth East Pacific hurricane develop east of the International Date Line by September 3 were 2014, 2015, and 2018.
 |
| Figure 8. Traffic signs and telecommunication relay poles were brought down by strong winds associated with Typhoon Jebi in Osaka on September 4, 2018. Image credit: Jiji Press/AFP/Getty Images. |
Jebi plows into central Japan as a Category 2 typhoon
Much weakened from its former Category 5 status, Typhoon Jebi struck Japan’s largest and most populous island, Honshu, on Tuesday local time. At least 7 deaths and more than 200 injuries have been reported, according to the Japan Times. According to the Japan Meteorological Agency (JMA), as reported by weather.com, Jebi moved inland near Kobe and Osaka several hours after clipping the eastern edge of Shikoku Province as a Category 2-equivalent storm around noon local time. Jebi’s forward motion accentuated the shrieking winds on its eastern side, with gusts reported as high as 130 mph at Kansai International Airport, 128 mph at Wakayama, and 106 mph at Osaka. Winds pushed a tanker into the only bridge connecting the Kansai airport with the mainland, stranding some 5000 people, according to the Japan Times. Airport officials said that some lanes on the bridge appeared to be unaffected, which should allow traffic to and from the airport once the storm abates.
More than 1.6 million power outages were reported in the Osaka area, and rainfall exceeded 10 inches in some areas, according to JMA. Japan’s public broadcasting network NHK reported that the Port of Osaka experienced its highest tides on record, topping the 2.93 meters (9.6 feet) recorded in Super Typhoon Nancy (see the live blog on Jebi maintained by the Japan Times).
Bob Henson co-wrote this post.


