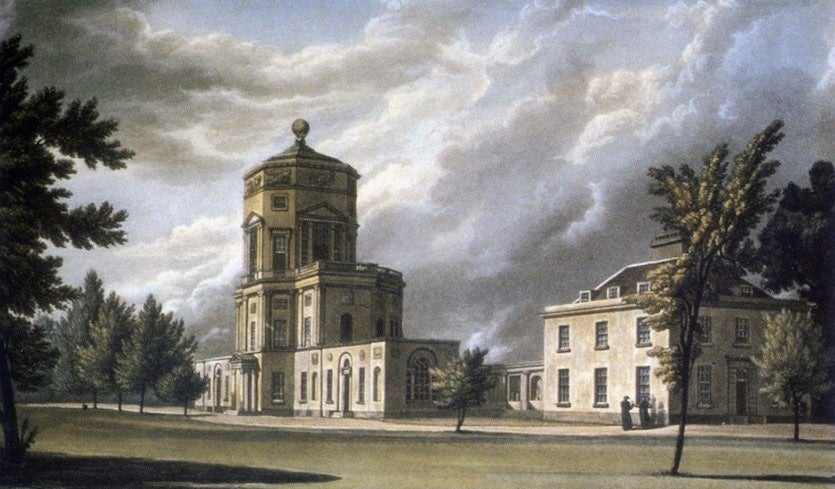
| Above: The Radcliffe Observatory in Oxford, England, as viewed from the southeast circa 1814 (about the same time the continuous daily series of temperature records commenced). Image credit: R. Ackerman, A History of the University of Oxford, 1814, Green Templeton College, Oxford. |
I recently received an advance copy of a fascinating weather book, Oxford Weather and Climate Since 1767, authored by Stephen Burt and Tim Burt (no relation to me or, for that matter, to each other!) and published by Oxford University Press. The Radcliffe Observatory in Oxford has one of the longest continuous weather records in the world, and thus its data contributes in a significant way to the climate change record.
Oxford Weather and Climate is probably the most detailed analysis of any one city’s weather and climate ever published. Over the course of its 544 pages every imaginable weather statistic is sliced and diced into an array of permutations, all beautifully illustrated in charts, tables, maps, and photographs, many in full color (the production quality of the book is outstanding!)
One might fairly ask: why all this for the small city of Oxford? As the Burts explained in a press release, “The Oxford temperature, barometric pressure and rainfall records have all been made with the best instruments of the time, on the same site, within a few meters of each other, for over 200 years. Almost every change of instrument or exposure was documented, so we have excellent metadata to go with the records themselves: such complete documentation is exceptional. Oxford also has what we believe to be the world’s longest unbroken record of sunshine duration, with daily records back to February 1880.”
 |
| Figure 1. The Radcliffe Meteorological Station in Oxford as it appeared in August 2018. Image credit: Stephen Burt. |
Longest periods of record (POR) for weather observations
The longest series of temperature records in the world is that for Central England, a collection of data from several different sites that date back continuously to 1659. The Oxford records form a significant part of the Central England series between 1815 and about 1920.
, 1659 to 2018") |
| Figure 2. Central England temperature series annual means (C°), 1659 to 2018, from work by Gordon Manley updated by the U.K. Met Office, with ten-year running mean shown in red. |
In their book Stephen and Tim publish a list of sites that have the oldest “mostly continuous” temperature records in the world. The “mostly” means perhaps a few months or years of data are missing, often because of military conflicts.
Precipitation records began in 1767 at the Radcliffe Meteorological Station, with temperature observations starting in 1815. The only sites with longer temperature POR’s than Oxford’s are the following:
1722 to date: Uppsala, Sweden (located about 40 miles north of Stockholm), although with several changes of site within a mile or so. Anders Celsius invented his thermometer scale while serving as an observer at Uppsala.
1725 to date: Padova (Padua), Italy.
1756 to date: Stockholm, Sweden.
1763 to date: Milan, Italy.
1773–1980: Kew Observatory, London, England, although observations are continuous only from 1848.
1775 to date: Prague, Czech Republic.
1781 to date: Hohenpeissenberg, Germany (located 50 miles southwest of Munich). This is the oldest mountain observatory in the world, sited at the elevation of 977 meters (3220 feet).
1794 to date: Armagh Observatory, Northern Ireland; although records are older than Oxford, there are breaks until the 1830s.
In the U.S. the oldest near-continuous weather records are those for Charleston, South Carolina, with precipitation data dating back to 1738. Chapel Hill, North Carolina, and Minneapolis, Minnesota (originally Ft. Snelling), have continuous temperature records since 1820 but from different locations within each city. New York City’s Central Park has the longest series of weather observations (since 1869) for a site that has not been relocated across a town or city at one time or another. (The Central Park site was moved about a mile across the park, from The Arsenal to Belvedere Castle, in 1920.)
A few standout statistics from Oxford
For those (like myself) who are interested in weather extremes, here are some of the site’s weather superlatives:
—The hottest day yet recorded in Oxford was 19 August 1932, when the temperature reached 35.1°C (95.2°F); this was equalled on 3 August 1990. The coldest night was Christmas Eve 1860, when the temperature fell to -17.8°C (0°F). Update: Oxford reported a high temperature of 36.5°C (97.7°F) on July 25, 2019.
—The longest spell of continuously below freezing temperatures was the 17 days from January 11 to 26, 1823; almost as long was a spell of 14 days in February 1947. In contrast, the summer of 1976 saw temperatures surpass 30°C (86°F) every day for 14 consecutive days from June 25 to July 8, more than twice as long as any other similar spell before or since.
 |
| Figure 3. An intense late-season snowstorm on April 24-25, 1908, as photographed in Oxfordshire. The snow depth was measured at 69cm (about 27”) in Abingdon (about ten miles south of Oxford). Image credit: Photo by Warland Andrews, courtesy Abingdon County Hall Museum. |
—In February 1888, a 20-hour snowstorm dumped over 600 mm (24”) of snow, the heaviest snowfall in Oxford’s records. (Interestingly, this came just weeks before the heaviest and deadliest snowstorm in U.S. history, the Great Blizzard of 1888.) Remarkably, in that same year, snow reportedly fell for 30 minutes in Oxford just after dawn on July 11 (!), the only record in over 200 years of a summer snowfall in the city. In the entire Oxford record this is the only instance of snow falling between mid-May and mid-October. Other locations in southern England also reported snow showers that day, confirming the account, although with a minimum temperature that morning of 5.1°C (41.2°F) it is likely that the frozen precipitation was ice pellets or graupel rather than real snow. [“Sleet” actually means “mixed rain and snow” in the UK!]
—In over 250 years of rainfall records in Oxford, no calendar month has (yet) remained completely dry, although April 1817 and April 2011 recorded just 0.5mm (0.02”) of rainfall each. The longest period without rainfall occurred during the Great Drought of 1976, when 40 consecutive days starting on 19 July remained rainless.
September 1774 retains the title of the wettest month yet recorded in Oxford, with 224mm (8.82”), four times the monthly average. Oxford’s wettest day was July 10, 1968, when 87.9mm (3.46”) fell in 24 hours.
 |
| Figure 4. Oxford’s “climate stripe” illustrates the progression of annual mean temperatures from 1815 to 2018. Note the remarkable warming of recent decades. For more about climate stripes, see this recent Category 6 post by Bob Henson. Image credit: Professor Ed Hawkins, University of Reading, U.K. |
What do Oxford’s long weather records tell us of climate change?
Here are a few snippets from over 200 years of records:
—There is unambiguous local evidence of climate change. Oxford has warmed by 1.72°C (3.10°F) over the last 200 years. The mean temperature over the last 30 years (1989-2018) stands at 11.06°C (51.84°F) and for the first 30 years of the record (1814-1843) the equivalent figure was 9.34°C (48.81°F). Only around 0.2°C of this increase can be attributed to Oxford’s urban growth, according to the Burts.
 |
| Figure 5. Annual averages of “hot days” (maximum temperature of 25°C/77°F or greater) and “heat wave days” (30°C/86°F) by decade at the Radcliffe Observatory, Oxford 1815-2018. Data to 1852 are from unscreened thermometers and are indicated in italics. |
—All of the top-five warmest years in Oxford have occurred since and including 2006, the warmest being 2014 with a mean temperature of 11.8°C (53.2°F). In contrast, the most recent ‘top-five coldest year was 140 years ago, in 1879, when the mean temperature was just 7.7°C (45.9°F). Summer 2018, with a mean temperature of 18.8°C (65.8°F), topped the list as the hottest summer yet recorded in Oxford, just nipping the previous record holders (1826 and 1976) by a tenth of a degree Celsius.
 in Oxford, 1767–2018") |
| Figure 6. Annual precipitation totals (mm) at the Radcliffe Observatory in Oxford, 1767–2018, together with a ten-year running mean plotted as a solid red line. The dotted blue line is the long-term linear trend, which is upward. |
 |
—Oxford is getting sunnier as well as warmer. Fractions of possible sunshine have increased since the 1960s, particularly in winter, the increase being largely attributed to anti-pollution legislation and the resulting decrease in winter fogs. Fogs are now only one-third as frequent as they were in the 1920s and 1930s.
—Although Oxford has become sunnier, there is a clear upward trend in precipitation over the past two centuries. The overall linear trend is highly significant. As we have already seen, the long-term linear trend in mean air temperature with time (since 1815) is also very strong and, taken together, these two results might suggest a possible long-term temperature-precipitation linkage.
Conclusion
Oxford Weather and Climate Since 1767 is a must-have book for anyone with a strong interest in weather history or climatology. It was released on May 30 in the U.K. and was released in the U.S. on June 30, although Amazon posts a July 30 on-sale date.
Christopher C. Burt
Weather Historian
Image Note: All images in this blog are from the book and are credited to Stephen and Tim Burt unless otherwise noted.


