| Above: Antarctic sea ice photographed during the four-year Southern Ocean Carbon and Climate Observations and Modeling study, which used oceanic floats to monitor carbon dioxide and track other key variables. The photo was taken during January, when the region's seasonal ice cover is dropping toward the annual minimum that occurs in late February or early March. Image credit: Hannah Zanowski/University of Washington/Flickr. |
Just two years after shrinking to its lowest extent ever measured, Antarctic sea ice may challenge that record a few weeks from now. This depletion comes just as scientists reported a harrowing sixfold increase in the loss of Antarctic land ice over the last 40 years. Unlike land ice, the loss of sea ice doesn’t contribute to sea level rise in itself, but it could help make some of Antarctica’s land ice more vulnerable (see below).
The extent of ice cover encircling the Antarctic coast began taking a nosedive in December, dropping even more quickly than usual for the time of year (late spring in the Southern Hemisphere). Since December 25, Antarctic ice extent has set calendar-day record lows every day for more than three solid weeks. Satellite-based records from the National Snow and Ice Data Center go back to 1979.
Typically, Antarctic ice reaches its minimum for the year in late February or early March (late summer). As of Monday, January 14, the extent was 3.979 million sq km, which is well below the value of 4.154 million sq km observed on that date in 2017. We still have a few weeks to go before 2019’s extent can challenge the lowest value measured at any time of year: 2.110 million square kilometers, observed on March 3, 2017.
A new all-time record-low extent isn’t yet a slam dunk, according to polar climate expert Cecilia Bitz (University of Washington). “The minimum won't happen for another 40 days or so, and the weather between now and the minimum could shrink or grow the margin that exists today,” Bitz said in an email.
 |
| Figure 1. Antarctic sea ice extent has been running well below all other years during the first two weeks of January 2019. Image credit: National Snow and Ice Data Center. |
Poles apart
The differing geographies of the Arctic and Antarctic lead to profoundly different patterns of sea ice growth and loss each year. The Arctic Ocean encircles the North Pole, so northern sea ice expands and contracts mainly within that giant basin. In contrast, southern sea ice is more like frosting than filling. The land mass of Antarctica, roughly centered on the South Pole, forces sea ice to grow and melt around its periphery, and that puts the bulk of southern sea ice closer to the equator than northern sea ice.
Given the overall higher latitudes of the Arctic ice pack, it’s historically been much easier for multiyear sea ice to gain a toehold there. This persistence serves as a buffer, tamping down the swings in extent from winter to summer and back. For example, in recent years, the Arctic’s ice extent has dropped from yearly peaks of around 14-15 million sq km. to lows of around 4-5 million sq. km, while the Antarctic’s sea ice extent has varied from 18-20 million sq. km. at peak to only 2-4 million sq. km. at minimum. (The National Snow and Ice Data Center has an excellent explainer on this topic.)
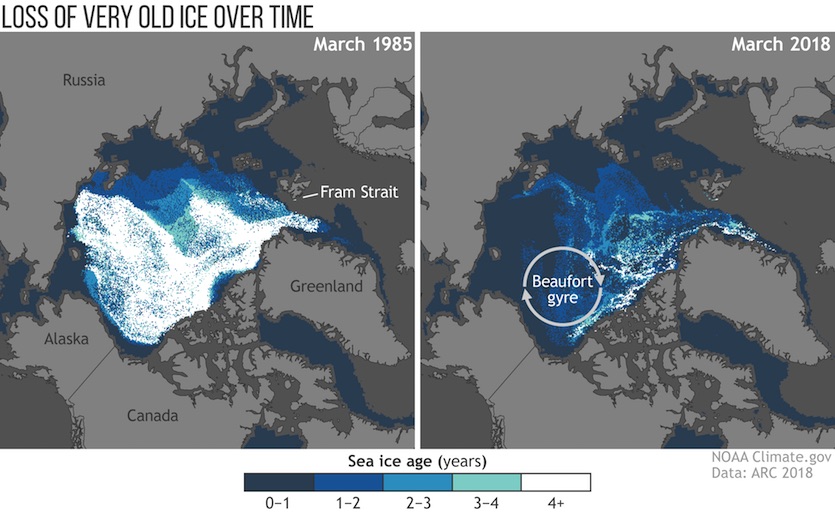
As the planet warms, the trajectories of northern and southern sea ice have unfolded in starkly differing ways. The Arctic’s storehouse of multiyear ice has been raided by warming in recent years (see Figure 2). Overall, the Arctic’s sea ice loss has been sadly consistent with the projections from climate models. Years of dramatic loss (such as 2007 and 2012) have been interspersed with periods of little change, but the overall downward trend line is clear. Arctic ice loss is also one of the factors behind Arctic amplification, in which warming trends become sharper at high northern latitudes than in more temperate zones.
According to NOAA’s 2018 Arctic Report Card, this past year brought the Arctic’s second-warmest air temperatures ever recorded; the second-lowest overall sea-ice coverage; the lowest recorded winter ice in the Bering Sea; and earlier plankton blooms due to early melting of sea ice in the Bering Sea.
 |
| Figure 2. NOAA’s 2018 Arctic Report Card found the Arctic region had the second-lowest overall sea-ice coverage on record. The map shows the age of sea ice in the Arctic ice pack in March 1985 (left) and March 2018 (right). Ice that is less than a year old is darkest blue. Ice that has survived at least 4 full years is white. Image credit: NOAA/Climate.gov, data courtesy Mark Tschudi, University of Colorado/CCAR. |
To the south, Antarctic sea ice actually become slightly more extensive, about 1-2% per decade, from the 1970s into the early 2010s, a development that’s not yet fully understood. A majority of simulations carried out in support of the IPCC’s Fifth Assessment Report predicted that Antarctic sea ice coverage should have declined between 1979 and 2013. The actual observed increase wasn’t hugely significant, but it did lead to successive record-high extents in 2012, 2013, and 2014.
In a 2015 review paper published in Nature Climate Change, a group of Antarctic experts identified some factors that may have enhanced regional sea ice production in spite of global warming. These included:
—stronger westerly winds ringing the continent
—increased meltwater flowing into the Southern Ocean
—a stronger prevailing low in the Amundsen Sea. This tends to favor cold offshore flow and enhanced ice production in the Ross Sea, with mild onshore flow and reduced sea ice in the Amundsen-Bellinghausen region.
Whatever its causes, the unexpectedly resilient Antarctic sea ice certainly wasn’t enough to make up for the myriad effects of planetary warming elsewhere. As Jeff Masters once put it: “Calling attention to Antarctic sea ice gain is like telling someone to ignore the fire smoldering in the attic, and instead go appreciate the coolness of the basement, because there is no fire there.”
 |
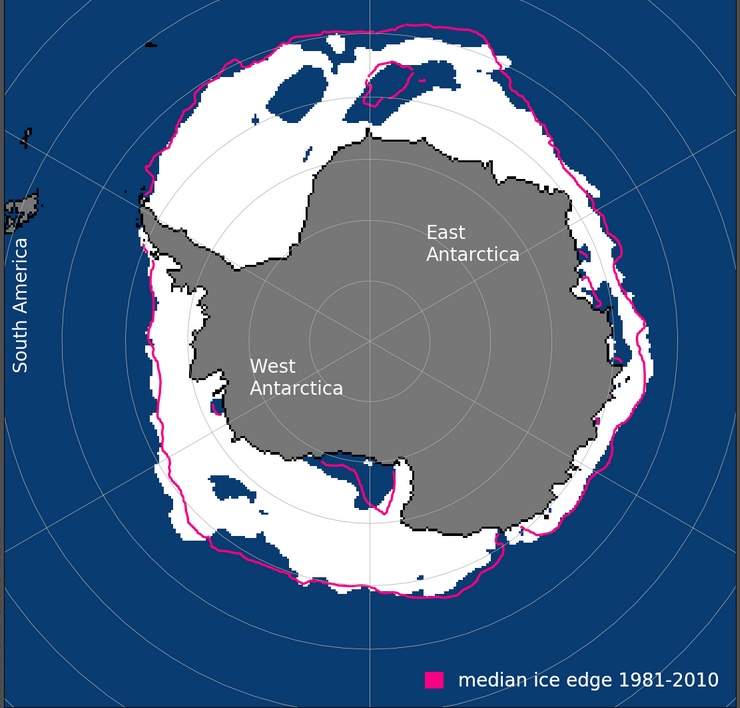
| Figure 3. Antarctic ice extent averaged 9.0 million sq. km. for December 2018, the third-lowest December average in data going back to 1978. The rightmost of the two large open areas (polynyas) near the top, in the Weddell Sea, include one located near the Maud Rise undersea feature. A 2017 paper explored the recent return of the large Maud Rise polynya after decades of absence. Image credit: National Snow and Ice Data Center. |
A dramatic about-face
Years of extra-abundant Antarctic sea ice came to a halt in mid-2015, when ice extent began dropping below average. The melt season of 2016-17 brought even more dramatic losses, including the record low extent noted above. The sea ice was only slightly more abundant in 2017-18.
“We’ve always suspected that the expansion of Antarctic sea ice which occurred through 2014 or so was a trend destined to reverse itself in a warming climate,” David Schneider (National Center for Atmospheric Research) said in an email.
The record-low ice extent of 2015-16 was produced by that year’s record-strong El Niño together with natural variability, according to a 2016 paper in Geophysical Research Letters led by UW’s Malte Stuecker, a postdoctoral researcher working with Bitz. They found that the powerhouse El Niño helped boost sea surface temperatures in the eastern Ross, Amundsen, and Bellinghausen Seas. Similarly, it's possible that warmth across the tropical Pacific—though now short of a full-fledged El Niño—may also be helping to warm the southern seas.
“El Niño is associated with atmospheric circulation patterns that raise sea surface temperatures and limit the expansion of sea ice around Antarctica,” said Schneider. There’s also longer-term warming of the Southern Ocean waters, which could be starting to have more of an effect on sea ice as well. “It will take focused study, careful observations, and computer modeling to really solve the puzzle,” Schneider said.
Researchers are also casting their eyes on the potential impact of Antarctic ice loss on a matter of intense interest: the ice shelves that keep massive volumes of ice from flowing seaward and pushing sea level to catastrophic heights. Robert Massom (Australian Antarctic Division) and colleagues examined this topic in a 2018 paper in Nature, “Antarctic ice shelf disintegration triggered by sea ice loss and ocean swell.” Their modeling showed that the much-publicized collapses of the Larsen A and B and Wilkins ice shelves may have been hastened by longer periods of ice-free conditions that allowed waves to batter and destabilize the shelves.
“Our analysis of satellite and ocean-wave data and modelling of combined ice shelf, sea ice and wave properties highlights the need for ice sheet models to account for sea ice and ocean waves,” Massom and coauthors concluded.


