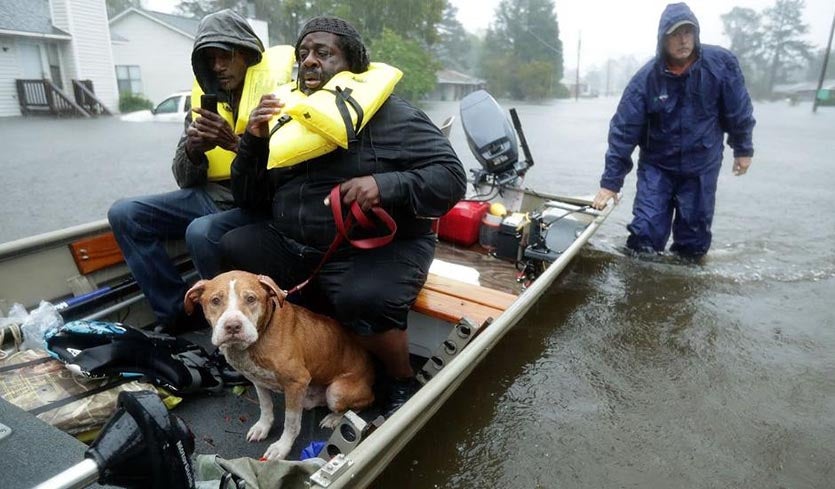
| Above: Volunteers help rescue residents and their pet from their flooded home during Hurricane Florence on September 14, 2018, in New Bern, North Carolina. Florence dumped the second greatest rains in U.S. history when measured by volume over a 14,000-square mile area. Image credit: Chip Somodevilla/Getty Images. |
Preliminary research by precipitation expert Dr. Kenneth Kunkel of the North Carolina Institute for Climate Studies, announced in September, found that the three highest-volume rainfall events in the U.S. in the last 70 years have occurred since 2016: Hurricane Harvey in Texas/Louisiana in 2017, Hurricane Florence in North Carolina in 2018, and a March 2016 storm in Louisiana. It is highly unusual to get three such extreme events in one three-year period, and the odds of this occuring were increased by global warming, which boosts the amount of water vapor in the air and increases the frequency and intensity of heavy precipitation events.
Dr. Kunkel’s ratings were based on four-day rainfall totals over an area of 14,000 square miles (an area 40% larger than the state of Maryland). Harvey delivered an average of 25.6 inches of rain over an area of 14,000 square miles, while Florence was a somewhat distant second place, with an average of 17.5 inches of rain over a like-sized area.
 |
| Figure 1. The top 30 highest-volume U.S. four-day rainfall totals over areas of 14,000 square miles since 1949. Hurricane Harvey and Hurricane Florence rank #1 and #2. Image credit: Dr. Kenneth Kunkel, North Carolina Institute for Climate Studies. |
The analysis only used stations that have been reporting reliably throughout the 70-year period, so only a small fraction of current reporting stations were used. However, the use of a consistent network of stations across the entire period increases the reliability of the resulting rankings. When looking at a bigger area--20,000 square mile--Harvey remained in first place, 1998′s Hurricane Georges was second, and Hurricane Florence fell to seventh place. The analysis has not been published or peer reviewed yet, but will be presented at the January 2019 meeting of the American Meteorological Society, Kunkel said. Below is a short description of the top-ten list of highest-volume U.S. rainfall events over a 14,000 square mile area over the past 70 years.
 |
| Figure 2. Storm-total rainfall from Hurricane Harvey, August 24 – 31, 2017. Harvey dumped over 40” (yellow colors) in Houston, with isolated amounts in excess of 50” (pink colors) south of Houston and northwest of Port Arthur. Image credit: NOAA. |
1) Hurricane Harvey, August 27 – 30, 2017: 25.6” over 14,000 square miles
Hurricane Harvey hit Rockport, Texas as a Category 4 hurricane with 130 mph winds on August 25, 2017, then stalled just west of Houston for two days, dumping prodigious rains. The storm then drifted out to sea, and made another landfall near Beaumont, Texas, dumping catastrophic rains of more than 25 inches in 24 hours. A total rainfall amount in excess of 60” was recorded at two locations near Port Arthur, Texas—the heaviest rainfall ever recorded in the U.S. from a tropical cyclone. Harvey dumped more than 30 inches of rain on 6.9 million people, while 1.25 million experienced over 45 inches and 11,000 had over 50 inches, based on 7-day rainfall totals ending August 31. Harvey caused $128 billion in damage and killed 89 people. Four attribution studies published in 2017 and 2018 have found that human-caused global warming made Harvey’s heavy rains more likely.
 |
| Figure 3. Observed 5-day rainfall amounts from Hurricane Florence, ending at 2 pm EDT September 18, 2018. Image credit: NWS |
2) Hurricane Florence, September 14 – 17, 2018: 17.5” over 14,000 square miles
Hurricane Florence made landfall at Wrightsville Beach, North Carolina on September 14, 2018 as a Category 1 hurricane with 90 mph winds. Florence slowed to a crawl as it moved inland, bringing record rains and record river flooding to 28 river gauges in the Carolinas. More than 30” of rain was recorded at several North Carolina stations, including 35.93” at Elizabethtown—an all-time record for the wettest tropical cyclone ever observed north of the Gulf Coast states. Heavy rainfall also occurred in South Carolina, with 23.63” observed near Loris—a new state record for rainfall from a tropical cyclone. It took two to three weeks for many river locations to fall below flood stage, with one river cresting a full month after Florence made landfall. At least 53 direct or indirect deaths were blamed on the storm, and Aon estimated that total economic losses would exceed $10 billion. Climate change made Florence’s most intense rains over North Carolina more than 50% greater in magnitude than they would have been otherwise, according to a first-of-its-kind experimental “pre-attribution” study done as the storm was approaching landfall.
 |
| Figure 4. Flood damage in Haughton, Louisiana, on March 9, 2016. Image credit: Michael Dean Newman. |
3) Northern Louisiana spring storm, March 8 – 11, 2016: 16.3” over 14,000 square miles
A record-strength upper-level low pressure system that stalled out over Northern Mexico and Southern Texas brought rainfall in excess of 20" in a four-day period near the Shreveport, Louisiana area, bringing historic flooding along the Sabine River basin on the Texas and Louisiana border. More than 1000 homes and businesses were damaged or destroyed, and the storm killed 5 people and did $2.4 billion in damage.
 |
| Figure 5. Rainfall map for Hurricane Georges of 1998. Image credit: NOAA. |
4) Hurricane Georges, September 27 – 30, 1998: 16.1” over 14,000 square miles
Hurricane Georges hit Mississippi on September 28, 1998 as a Category 2 storm with 105 mph winds. Georges stalled over southern Mississippi for about 12 hours, then drifted east at 5 – 10 mph before finally dissipating near the Florida/Georgia coast three days after making landfall. The slow movement of the storm led to massive rains along the Gulf coasts of Louisiana, Mississippi, Alabama, and the Florida panhandle. Two-day rainfall amounts of 15 - 30 inches were observed in parts of Alabama, Mississippi and Florida. Total U.S. damage (including Puerto Rico and the Virgin Islands) was $9.3 billion; the storm killed four people along the U.S. Gulf Coast.
 |
| Figure 6. Rainfall map for Hurricane Beulah of 1967. Image credit: NOAA. |
5) Hurricane Beulah, September 19 – 22, 1967: 14.7” over 14,000 square miles
Hurricane Beulah made landfall on September 20, 1967 near Brownsville, Texas as a Category 3 storm. After making landfall, Beulah stalled, then moved to the south and southwest, which allowed rain bands to become essentially stationary across Bee County, Texas for multiple days. Between 15 and 25 inches of rain fell over South Texas. Beulah’s floods were exacerbated by saturated soils from heavy rains in August and in early September. Record river flooding resulted, with some records that still stand today. Many towns across South Texas were severely flooded and water remained on the ground for months in poor drainage areas of the Coastal Bend and Coastal Plains.
Hurricane Beulah was responsible for 58 deaths, with 15 of those occurring in Texas. Damages totaled $217 million in 1967 dollars ($1.6 billion 2018 dollars). At the time, Beulah set the record for number of tornadoes associated with a tropical system (115). This record was broken in 2004 by Hurricane Ivan’s 120 tornadoes.
 |
| Figure 7. Burning oil from breached pipeline caused by the October 1994 flood on the San Jacinto River at I-10 in Houston. Some structures were flooded and burned. Image credit: USGS. |
6) Southeast Texas storm, October 16 - 19, 1994: 14.7” over 14,000 square miles
High levels of moisture over southern Texas associated with Hurricane Rosa from the Pacific Coast of Mexico, combined with low-level moisture from the Gulf of Mexico drawn inland to a warm front by a strong low-pressure system over the southern Rocky Mountains, spawned vigorous thunderstorms that produced torrential rains of 8 - 28 inches in five days over southeast Texas. Floods at the 1-in-100-year level were equaled or exceeded at 19 of the 43 river gauges in the area. The resulting flooding killed 19 people and caused $1.7 billion in damage.
 |
| Figure 8. Aerial view of flooding in Hammond, Louisiana on August 13, 2016. Image credit: AP Photo/Max Becherer. |
7) Southern Louisiana tropical disturbance, August 13 – 16, 2016: 14.5” over 14,000 square miles
Torrential rains of 20 - 30” fell over southern Louisiana August 9 – 16, 2016 from a tropical depression-like storm that moved slowly across the southern U.S. for a week. Watson, Louisiana received an astounding 31.39 inches of rain from the storm, and two-day rainfall totals in the hardest hit areas reached the 1-in-500-year event threshold. More than 30,000 people were rescued from the floodwaters that damaged or destroyed over 50,000 homes, 100,000 vehicles and 20,000 businesses. Thirteen people were killed, and damage was estimated at $10.6 billion, making it the second most expensive non-hurricane related flood in U.S. history, behind the $37 billion in damage from the summer 1993 flooding in the Midwest. van der Wiel et al., 2016, Rapid attribution of the August 2016 flood-inducing extreme precipitation in south Louisiana to climate change, concluded that human-caused climate change had made 3-day extreme precipitation events along the central Gulf Coast like this one 1.4 times more likely to occur in 2016 compared to 1900.
 |
| Figure 9. Oct. 12, 1962: The steeple atop historic Campbell Hall, on the Monmouth campus of the Oregon College of Education (now Western Oregon University), topples during 90-mph wind gusts from the Columbus Day Storm. Photo by Wes Luchau. |
8) Columbus Day Storm, October 11 – 14, 1962: 14.4” over 14,000 square miles
The ‘Big Blow’, as the Columbus Day Storm that hit the Pacific Northwest on October 12, 1962 is nicknamed, ranked as one of the deadliest and most destructive in western U.S. history. The storm was the rejuvenated extratropical version of Typhoon Frieda, which peaked as a Category 3 storm with 115 mph winds on October 4. At least 46 deaths were attributed to the storm in Oregon and Washington, and a further 2 to 8 in California. Damage was estimated at $235 million ($2 billion in 2018 dollars), and some 53,000 homes were damaged or destroyed.
In the Santa Cruz Mountains, 20 miles south of San Francisco, Ben Lomond recorded 14.10” of rain in one 24-hour period on October 12-13. This remains the greatest 24-hour rainfall during October in California history. Orinda (just over the hill from Oakland) received an astonishing 18.41” over the two-day period of storm rainfall (a 1-in-6500-year rainfall, according to the California Dept. of Water Resources). Landslides in the Oakland Hills destroyed numerous structures and killed 2 children. Forbestown, in northern California near the Feather River, had the greatest 3-day precipitation total of any location in the Pacific Northwest with 25.78”. See Chris Burt’s blog for more on the storm.
 |
| Figure 10. The fire station in Santa Cruz, California during the December 1955 flood. The San Lorenzo River topped its banks and inundated the downtown area of Santa Cruz, killing 7, displacing 2830 people, and causing damage of $76 million (2018 dollars). Image credit: City of Santa Cruz. |
9) Central California winter storm, December 22 – 25, 1955: 14.2” over 14,000 square miles
An intense low-pressure system and its associated atmospheric river brought a 4-day deluge to central California on December 22 – 25, 1955. Rain in the high Sierras on top of a six-foot snow pack contributed heavily to floods that rampaged through the Central Valley. Record stream flows occurred in the west third of Nevada, the northern two-thirds of California, western Oregon, a third of western Idaho, and minor parts of Washington. At 12:04 a.m. on December 24, a levee on the west bank of the Feather River collapsed and a wall of water 21 feet high entered the county, flooding 90 percent of Yuba City and the farmlands in the southern Yuba City basin. Some 600 people were rescued by helicopter, but 37 people drowned. A statewide disaster was declared, with the storm resulting in 74 deaths and $1.9 billion in damage (2018 dollars).
 |
| Figure 11. Rainfall map for Tropical Storm Alberto. Image credit: NOAA. |
10) Tropical Storm Alberto, July 4 – 7, 1994: 13.6” over 14,000 square miles
Tropical Storm Alberto made landfall near Destin, Florida on July 3, 1994. Steering currents collapsed after Alberto moved inland, and the remnants of the storm brought torrential 10 – 25-inch rains in 3 days. Widespread flooding and agricultural damage occurred in parts of Georgia, Alabama, and panhandle of Florida. The floods killed 19 people and caused $1.7 billion in damage.


