WunderBlog Archive » Dr. Ricky Rood's Climate Change Blog
Category 6 has moved! See the latest from Dr. Jeff Masters and Bob Henson here.Enjoying the Cold
Enjoying the Cold
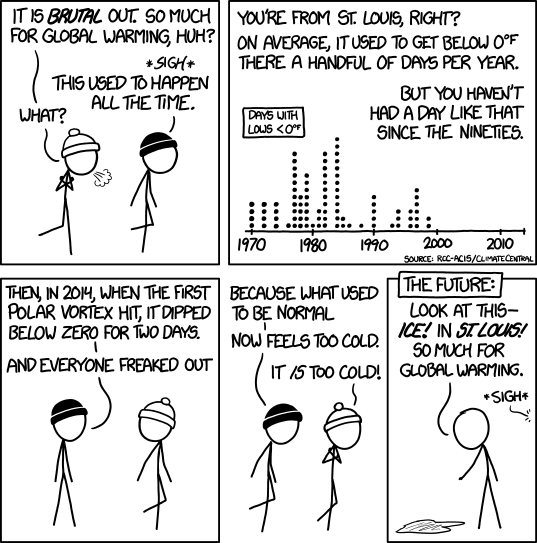
In the last couple of weeks several people have sent me this comic, Cold, from xkcd. The cartoon draws from the work at Climate Central, an organization that is doing excellent work with data and communication about climate, weather and climate change. The point of the cartoon is that if you look back at the weather of not so long along ago, we saw cold temperatures like we have seen in the U.S. this winter. The planet was warmed up enough that we are not used to it being cold.
Every month the National Climatic Data Center releases an update on its Climate Monitoring page. In the February update, the graph of the differences (anomalies) from the 1981-2010 average shows that the eastern half of the continental U.S. was 4 – 5 degrees Celsius colder than average. Northern Siberia was also very cold. Look at Alaska (part of the U.S.), Greenland and China - downright toasty.
Figure 1: January 2014 temperature differences from a 1981-2010 average. From the National Climatic Data Center.
When the cold of the eastern U.S. is put into a global perspective, January 2014 was the 4th warmest global average since 1880. The U.S. was 53rd coolest, near the middle. If you go back to my blog on the behavior of the Arctic Oscillation, I show maps of 2010 and 2011 which were so cold that they motivated congressional hearings about climate change. In that blog, I also show figures from 1979, which was the coldest winter in the continental U.S.
As I started to put this into context, the first thing that I noticed was that those hearings-motivating winters of 2010 and 2011 were about 8 degrees Celsius warmer than 1979. This winter, 2013 – 2014, is objectively cold, but it is not colder than 1979. If you examine the figure above, the anomaly was calculated from the average 1981-2010, which includes the warmest decade we have measured since 1880. Therefore, the anomaly looks larger than it would if calculated against an earlier 30 year period or a 20th century average.
The last month when the global mean monthly average was below the 20th century average was February 1985. If I count correctly, then it has been 29 years, or 348 months, since we, globally, have experienced a month colder than the 20th century average. If we look at years, rather than individual months, then this span of time extends back to 1976. I remember the fall and winter of 1976 - 1977 very well. I had moved to Tallahassee. It snowed. People raked it under the trees to take pictures. People left their sprinklers on to see ice. They destroyed their trees.

Figure 2: Annual average temperature differences from a 20th average. Calculated using tools from National Climatic Data Center.
The extraordinary string of months and years above the 20th century average will continue. In a year, we will have gone 30 years, the official averaging time of climate, since we will have experienced a “cool” month. This locally cold winter in the eastern U.S. is more like the late 1970s than the nineties in the comic above. A big difference is that this locally cold winter still does not affect the average enough to keep January 2014, globally, from being one of the warmest on record. The cartoon is right, not only are we not used to it being cold, many of residents of the U.S. have never actually experienced such cold. Same is true for the stink bugs of Virginia.
r
Just Temperature
Climate Change News Climate Change
The views of the author are his/her own and do not necessarily represent the position of The Weather Company or its parent, IBM.