WunderBlog Archive » Category 6™
Category 6 has moved! See the latest from Dr. Jeff Masters and Bob Henson here.A Rare Mid-Year El Niño Event Is Strengthening
The robust El Niño event anticipated for more than a year is finally coming to fruition, according to the latest observations and forecasts. NOAA's latest monthly analysis, issued on Thursday morning, continues the El Niño Advisory already in effect and calls for a 90% chance of El Niño conditions persisting through the summer, with a greater-than-80% chance they will continue through the end of 2015. These are the highest probabilities yet for the current event, and a sign of increased forecaster confidence--despite the fact that we're in northern spring, the very time when El Niño outlooks are most uncertain.

Figure 1. A schematic showing the processes involved in El Niño. The trade winds shown by the arrow are weaker at this point than during La Niña or neutral conditions; at certain times and at some locations, they may even reverse, blowing from west to east. For a full explanation of the El Niño-Southern Oscillation, including additional graphics, see the website published by the Australian Bureau of Meteorology. Image credit: BOM.
Forecasters and computer models alike have been confounded by this event. In a classic El Niño, the ocean and atmosphere are synchronized in a mutually reinforcing pattern that pushes warm sea-surface temperatures (SSTs) and thunderstorm activity along the equator eastward for thousands of miles, from Indonesia toward South America (see Figure 1). Sometimes the atmosphere doesn't respond to a "kick" from the ocean, and an embryonic El Niño fails to develop. This was the case last spring, when a powerful oceanic Kelvin wave (a broad, shallow, slow-moving impulse) pushed warm water east across the Pacific tropics. Keying off this wave, many of the global models used in El Niño prediction called for a moderate or even strong El Niño by the fall of 2014. However, the normal east-to-west trade winds never reversed, which helped torpedo the needed ocean-atmosphere synchrony. The ocean tried again last fall with another Kelvin wave, but again the atmosphere failed to respond, and the SST warming disappeared after a few weeks.

Figure 2. Recent weekly departures from normal across the four tropical Pacific regions (top map) that are regularly monitored for signs of El Niño and La Niña. Image credit: NOAA Climate Prediction Center.
This time, things appear to be different: SSTs have warmed for the last several months, and more recently, trade winds have weakened. As of Monday, the weekly-averaged SSTs over the four regions monitored for El Niño were all at least 1.0°C above average (see Figure 2, right). If the values for all four regions can sustain this feat throughout the next month, it'll be the first time this has happened since November 1997, during the strongest El Niño event of the 20th century. Just as significant, the persistently warmer-than-normal SSTs over the western tropical Pacific have now cooled, which helps support the reversal of trade winds so critical to El Niño. The current SST map now resembles a more textbook-like El Niño signature (see Figure 3, below), and there is every indication that the ocean-atmosphere coupling will now continue to grow.
An event out of season
As far as the eastern tropical Pacific goes, it's beginning to look a lot like Christmas. El Niño--"the Christ child" in Spanish--gets its name from its tendency to bring above-average SSTs to the coasts of Peru and Ecuador around Christmastime. The climatology of the eastern Pacific tends to support El Niño and La Niña development during the northern autumn, maximum strength in the winter, and decay in the spring. The current event is thus bucking climatology as it continues into northern spring. The three-month departure from average in the Niño3.4 region reached the El Niño threshold of +0.5°C in Oct-Nov-Jan 2014-15, and it's hovered in the weak range (+0.5 to +1.0°C] ever since, with a value of +0.6°C for Feb-Mar-Apr 2015. Only 12 of the 65 prior years in the historical database of El Niño/Southern Oscillation (ENSO) events have seen a value of at least +0.5°C during the Feb-Mar-Apr period. Water temperatures in the Niño3.4 region are normally at their warmest in May, so the current warm anomaly is leading to especially toasty SSTs of around 29°C (84°F). If this El Niño event does intensify, as models strongly suggest it will (see below), it'll be one for the record books. There are no analogs in the database for a weak event in northern winter that becomes a stronger event by summer. Persisting into northern fall will also greatly raise the odds of this becoming a rare two-year event. In every case since at least 1950 when El Niño conditions were present by Jul-Aug-Sep, the event continued into the start of the next calendar year. Two-year El Niños are more unusual than two-year La Niñas, but they do happen, as in 1968-1970 and 1986-1988. See the new climate.gov blog by Emily Becker for more on the unusual timing of this event.

Figure 3. Departures from normal for sea-surface temperatures as measured on May 13, 2015. The warmer-than-average belt across the central and eastern tropical Pacific is characteristic of El Niño. Image credit: tropicaltidbits.com.
Northern spring is an especially difficult time to predict El Niño evolution. Computer-model skill at predicting ENSO is at its lowest then, in part because of reduced east-west gradients in SSTs across the tropical Pacific, but also due to factors that have yet to be fully understood. "The Spring Barrier is the climate forecaster’s equivalent of mayhem," says Michelle L'Heureux in an excellent climate.gov discussion of what forecasters often call the "spring predictability barrier." Skill does begin to improve for forecasts produced in May, according to L'Heureux, so we can begin placing more trust in the 2015-16 El Niño predictions from this point onward--although L'Heureux notes that even model runs produced in August still miss about a quarter of the winter variability in ENSO.
How strong will it get?
This week's Niño3.4 SST anomaly of +1.0°C is at the threshold of a moderate-strength event. Another 0.5°C would push the event into the strong range, which was last observed in late 2009 and early 2010. Klaus Wolter (NOAA Earth Systems Laboratory) has devised a Multivariate ENSO Index (MEI) that uses multiple indicators to diagnose El Niño and La Niña. Last year's event briefly nudged into Wolter's "strong" category (defined as the top 10% of events) before subsiding. The MEI is now again at the threshold of "strong," and a statistical model recently run by Wolter finds a 44% chance that strong conditions will be in place during Aug-Sep 2015, the time of year when this statistical model is most accurate. "We have had some pretty unusual (non-persistent) behavior of the ENSO-system in the last four years that was anticipated better than by flipping a coin, especially last year, but certainly not perfectly," said Wolter in an email update.

Figure 4. Projected values of the Niño3.4 departure from average by September, based on ensemble averages from a variety of global ocean-atmosphere models (listed along left-hand side). The La Niña and El Niño thresholds indicated by the shading on this graphic are 0.8°C, the values used in Australia. The comparable threshold used by NOAA is 0.5°C, because U.S. impacts can occur with smaller departures from average. Image credit: Australia Bureau of Meteorology.
The dynamical models run at various centers around the world to predict ENSO are now unanimous in keeping El Niño going into northern autumn. The values shown in Figure 4 (above) are ensemble averages for each model, which means they smooth out the range of outcomes depicted by multiple runs of the same model. (Each run has slight differences in its starting point, to account for features too small to be observed and the natural variations that result). Within each ensemble, there's a wide range of outcomes projected by autumn 2015, from a borderline El Niño to much more extreme values. Figure 5 (below) includes both the ensemble average and the individual members for the seven models in the North American Multi-Model Ensemble. A number of individual model runs push the Niño3.4 index well above +2.5°C over the next few months, and the entire NMME average is around +2.2°C for November and December. By comparison, the highest three-month departure observed in the entire 65-year NOAA database is +2.4°C (Nov-Dec-Jan 1997-98).
Now is a very good time to keep in mind that global models tend to hyperventilate a bit when it comes to strong ENSO events. "This is because the El Niño events are too shallow in the models," says Kevin Trenberth (National Center for Atmospheric Research). "They don't have as much ocean heat content engaged, so there is more of a surface signal." As for the stark variation among individual model runs, it may be due to the spring predictability barrier, as well as the result of another very powerful Kelvin wave and a strong westerly wind burst now traversing the Pacific. Models can easily predict a strengthening of El Niño conditions over the next several months as these features continue eastward, but it's tougher for the models to discern exactly what will happen after the Kelvin wave reaches South America. Trenberth points to the ocean-atmosphere coupling known as the Bjerknes feedback mechanism: "What happens after this Kelvin wave response is all over the place. This El Niño is being fought by the annual cycle, which tries to make SSTs cold by Sept-Oct. That tendency keeps the warmest waters back near the International Date Line and cuts off the Bjerknes feedback. If the SSTs develop to be big enough to overcome the annual cycle tendencies, then the Bjerknes feedback can kick in."

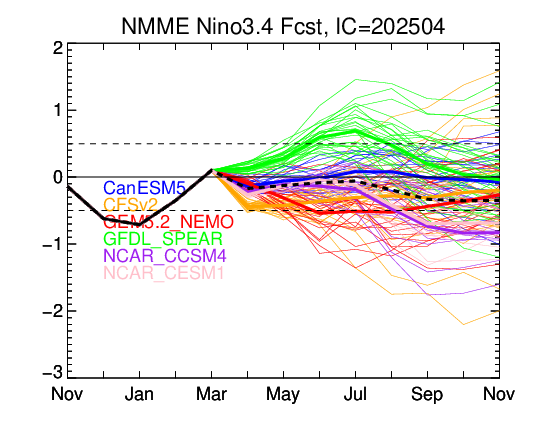
Figure 5. Projected evolution of Niño3.4 temperatures from members of the North American Mutli-Model Ensemble (members listed at top left). Dashed lines denote individual model runs; solid lines denote ensemble averages for each model. Image credit: NOAA Climate Prediction Center.
What can we expect this summer?
Because it's quite rare to have intensifying El Niño conditions at this time of year, it's difficult to glean a confident signal from past events on how El Niño might affect U.S. summer weather. The global effects of El Niño arise from a shifting of showers and thunderstorms into the central and eastern tropical Pacific, which causes a reverberating sequence of atmospheric waves that tend to enhance precipitation in some areas and reduce it in others. In midlatitudes, these relationships, called teleconnections, are usually strongest in the winter hemisphere; for example, Australia often falls into drought when El Niño is developing in Jun-Jul-Aug (see Figure 6). If a strong El Niño does develop and persists into northern winter, the likely U.S. impacts would be more clear-cut, including wetter-than-average conditions across the southern half of the country, from California through Texas to Florida. This month could be seen as a sneak preview of sorts, with soggy conditions prevalent across the central and southern Plains and two unusually-wet-for-May systems reaching southern California, one last weekend and another now on its way. There is some hope for drought relief in the Golden State, given that the odds of an wetter-than-normal California rise sharply for the strongest El Niño events, but by no means would a wet winter be guaranteed. The strong El Niño of 1987-88 (which happened to be the second year of a two-year event) produced a drier-than-average winter from California to Washington.
Given that El Niño tends to suppress hurricane formation in the North Atlantic, the odds of a quiet season in that basin are growing by the month. However, a season with few storms doesn't necessarily translate into a low-impact year: the anemic 1992 season included the catastrophic Hurricane Andrew. And it's possible (though unlikely) to have a busy Atlantic hurricane season even during El Niño. Right in the middle of the weak-to-moderate two-year El Niño event of 1968-70, the Atlantic produced its most active season in 36 years, with a total of 18 named storms, 12 hurricanes, and 5 major hurricanes--including the horrific Hurricane Camille.
Busy day on the blog!
For more on today's happenings, see the earlier posts by Jeff Masters on Typhoon Dolphin, which is threatening Guam, and on the incredibly hot temperatures in Spain, which have smashed European records for the month of May.
Bob Henson

Figure 6. Global ENSO teleconnections (seasonal tendencies linked to El Niño and La Niña) for northern summer (June - August). Image credit: NOAA.
Figure 1. A schematic showing the processes involved in El Niño. The trade winds shown by the arrow are weaker at this point than during La Niña or neutral conditions; at certain times and at some locations, they may even reverse, blowing from west to east. For a full explanation of the El Niño-Southern Oscillation, including additional graphics, see the website published by the Australian Bureau of Meteorology. Image credit: BOM.
Forecasters and computer models alike have been confounded by this event. In a classic El Niño, the ocean and atmosphere are synchronized in a mutually reinforcing pattern that pushes warm sea-surface temperatures (SSTs) and thunderstorm activity along the equator eastward for thousands of miles, from Indonesia toward South America (see Figure 1). Sometimes the atmosphere doesn't respond to a "kick" from the ocean, and an embryonic El Niño fails to develop. This was the case last spring, when a powerful oceanic Kelvin wave (a broad, shallow, slow-moving impulse) pushed warm water east across the Pacific tropics. Keying off this wave, many of the global models used in El Niño prediction called for a moderate or even strong El Niño by the fall of 2014. However, the normal east-to-west trade winds never reversed, which helped torpedo the needed ocean-atmosphere synchrony. The ocean tried again last fall with another Kelvin wave, but again the atmosphere failed to respond, and the SST warming disappeared after a few weeks.
Figure 2. Recent weekly departures from normal across the four tropical Pacific regions (top map) that are regularly monitored for signs of El Niño and La Niña. Image credit: NOAA Climate Prediction Center.
This time, things appear to be different: SSTs have warmed for the last several months, and more recently, trade winds have weakened. As of Monday, the weekly-averaged SSTs over the four regions monitored for El Niño were all at least 1.0°C above average (see Figure 2, right). If the values for all four regions can sustain this feat throughout the next month, it'll be the first time this has happened since November 1997, during the strongest El Niño event of the 20th century. Just as significant, the persistently warmer-than-normal SSTs over the western tropical Pacific have now cooled, which helps support the reversal of trade winds so critical to El Niño. The current SST map now resembles a more textbook-like El Niño signature (see Figure 3, below), and there is every indication that the ocean-atmosphere coupling will now continue to grow.
An event out of season
As far as the eastern tropical Pacific goes, it's beginning to look a lot like Christmas. El Niño--"the Christ child" in Spanish--gets its name from its tendency to bring above-average SSTs to the coasts of Peru and Ecuador around Christmastime. The climatology of the eastern Pacific tends to support El Niño and La Niña development during the northern autumn, maximum strength in the winter, and decay in the spring. The current event is thus bucking climatology as it continues into northern spring. The three-month departure from average in the Niño3.4 region reached the El Niño threshold of +0.5°C in Oct-Nov-Jan 2014-15, and it's hovered in the weak range (+0.5 to +1.0°C] ever since, with a value of +0.6°C for Feb-Mar-Apr 2015. Only 12 of the 65 prior years in the historical database of El Niño/Southern Oscillation (ENSO) events have seen a value of at least +0.5°C during the Feb-Mar-Apr period. Water temperatures in the Niño3.4 region are normally at their warmest in May, so the current warm anomaly is leading to especially toasty SSTs of around 29°C (84°F). If this El Niño event does intensify, as models strongly suggest it will (see below), it'll be one for the record books. There are no analogs in the database for a weak event in northern winter that becomes a stronger event by summer. Persisting into northern fall will also greatly raise the odds of this becoming a rare two-year event. In every case since at least 1950 when El Niño conditions were present by Jul-Aug-Sep, the event continued into the start of the next calendar year. Two-year El Niños are more unusual than two-year La Niñas, but they do happen, as in 1968-1970 and 1986-1988. See the new climate.gov blog by Emily Becker for more on the unusual timing of this event.
Figure 3. Departures from normal for sea-surface temperatures as measured on May 13, 2015. The warmer-than-average belt across the central and eastern tropical Pacific is characteristic of El Niño. Image credit: tropicaltidbits.com.
Northern spring is an especially difficult time to predict El Niño evolution. Computer-model skill at predicting ENSO is at its lowest then, in part because of reduced east-west gradients in SSTs across the tropical Pacific, but also due to factors that have yet to be fully understood. "The Spring Barrier is the climate forecaster’s equivalent of mayhem," says Michelle L'Heureux in an excellent climate.gov discussion of what forecasters often call the "spring predictability barrier." Skill does begin to improve for forecasts produced in May, according to L'Heureux, so we can begin placing more trust in the 2015-16 El Niño predictions from this point onward--although L'Heureux notes that even model runs produced in August still miss about a quarter of the winter variability in ENSO.
How strong will it get?
This week's Niño3.4 SST anomaly of +1.0°C is at the threshold of a moderate-strength event. Another 0.5°C would push the event into the strong range, which was last observed in late 2009 and early 2010. Klaus Wolter (NOAA Earth Systems Laboratory) has devised a Multivariate ENSO Index (MEI) that uses multiple indicators to diagnose El Niño and La Niña. Last year's event briefly nudged into Wolter's "strong" category (defined as the top 10% of events) before subsiding. The MEI is now again at the threshold of "strong," and a statistical model recently run by Wolter finds a 44% chance that strong conditions will be in place during Aug-Sep 2015, the time of year when this statistical model is most accurate. "We have had some pretty unusual (non-persistent) behavior of the ENSO-system in the last four years that was anticipated better than by flipping a coin, especially last year, but certainly not perfectly," said Wolter in an email update.
Figure 4. Projected values of the Niño3.4 departure from average by September, based on ensemble averages from a variety of global ocean-atmosphere models (listed along left-hand side). The La Niña and El Niño thresholds indicated by the shading on this graphic are 0.8°C, the values used in Australia. The comparable threshold used by NOAA is 0.5°C, because U.S. impacts can occur with smaller departures from average. Image credit: Australia Bureau of Meteorology.
The dynamical models run at various centers around the world to predict ENSO are now unanimous in keeping El Niño going into northern autumn. The values shown in Figure 4 (above) are ensemble averages for each model, which means they smooth out the range of outcomes depicted by multiple runs of the same model. (Each run has slight differences in its starting point, to account for features too small to be observed and the natural variations that result). Within each ensemble, there's a wide range of outcomes projected by autumn 2015, from a borderline El Niño to much more extreme values. Figure 5 (below) includes both the ensemble average and the individual members for the seven models in the North American Multi-Model Ensemble. A number of individual model runs push the Niño3.4 index well above +2.5°C over the next few months, and the entire NMME average is around +2.2°C for November and December. By comparison, the highest three-month departure observed in the entire 65-year NOAA database is +2.4°C (Nov-Dec-Jan 1997-98).
Now is a very good time to keep in mind that global models tend to hyperventilate a bit when it comes to strong ENSO events. "This is because the El Niño events are too shallow in the models," says Kevin Trenberth (National Center for Atmospheric Research). "They don't have as much ocean heat content engaged, so there is more of a surface signal." As for the stark variation among individual model runs, it may be due to the spring predictability barrier, as well as the result of another very powerful Kelvin wave and a strong westerly wind burst now traversing the Pacific. Models can easily predict a strengthening of El Niño conditions over the next several months as these features continue eastward, but it's tougher for the models to discern exactly what will happen after the Kelvin wave reaches South America. Trenberth points to the ocean-atmosphere coupling known as the Bjerknes feedback mechanism: "What happens after this Kelvin wave response is all over the place. This El Niño is being fought by the annual cycle, which tries to make SSTs cold by Sept-Oct. That tendency keeps the warmest waters back near the International Date Line and cuts off the Bjerknes feedback. If the SSTs develop to be big enough to overcome the annual cycle tendencies, then the Bjerknes feedback can kick in."
Figure 5. Projected evolution of Niño3.4 temperatures from members of the North American Mutli-Model Ensemble (members listed at top left). Dashed lines denote individual model runs; solid lines denote ensemble averages for each model. Image credit: NOAA Climate Prediction Center.
What can we expect this summer?
Because it's quite rare to have intensifying El Niño conditions at this time of year, it's difficult to glean a confident signal from past events on how El Niño might affect U.S. summer weather. The global effects of El Niño arise from a shifting of showers and thunderstorms into the central and eastern tropical Pacific, which causes a reverberating sequence of atmospheric waves that tend to enhance precipitation in some areas and reduce it in others. In midlatitudes, these relationships, called teleconnections, are usually strongest in the winter hemisphere; for example, Australia often falls into drought when El Niño is developing in Jun-Jul-Aug (see Figure 6). If a strong El Niño does develop and persists into northern winter, the likely U.S. impacts would be more clear-cut, including wetter-than-average conditions across the southern half of the country, from California through Texas to Florida. This month could be seen as a sneak preview of sorts, with soggy conditions prevalent across the central and southern Plains and two unusually-wet-for-May systems reaching southern California, one last weekend and another now on its way. There is some hope for drought relief in the Golden State, given that the odds of an wetter-than-normal California rise sharply for the strongest El Niño events, but by no means would a wet winter be guaranteed. The strong El Niño of 1987-88 (which happened to be the second year of a two-year event) produced a drier-than-average winter from California to Washington.
Given that El Niño tends to suppress hurricane formation in the North Atlantic, the odds of a quiet season in that basin are growing by the month. However, a season with few storms doesn't necessarily translate into a low-impact year: the anemic 1992 season included the catastrophic Hurricane Andrew. And it's possible (though unlikely) to have a busy Atlantic hurricane season even during El Niño. Right in the middle of the weak-to-moderate two-year El Niño event of 1968-70, the Atlantic produced its most active season in 36 years, with a total of 18 named storms, 12 hurricanes, and 5 major hurricanes--including the horrific Hurricane Camille.
Busy day on the blog!
For more on today's happenings, see the earlier posts by Jeff Masters on Typhoon Dolphin, which is threatening Guam, and on the incredibly hot temperatures in Spain, which have smashed European records for the month of May.
Bob Henson
Figure 6. Global ENSO teleconnections (seasonal tendencies linked to El Niño and La Niña) for northern summer (June - August). Image credit: NOAA.
The views of the author are his/her own and do not necessarily represent the position of The Weather Company or its parent, IBM.